Abstract
Comprehensive large cohort studies that collect a wide variety of genomic, epigenomic and clinical data are increasingly commonplace in the life sciences. While large sample sizes are still limited to well-funded consortia, the continuous cost decrease of data acquisition will allow individual labs to create larger datasets with fewer resources and will make genomic data analysis for the diagnosis of patients feasible. While this opens unprecedented possibilities for understanding the molecular processes underlying many diseases, it also poses challenges, especially with respect to data analysis and data management. There is a high demand for better analysis and visualization methods to keep pace with the increasing amount of data. At the same time, these data acquisition methods will also revolutionize the discovery and diagnosis of rare diseases. The integration of genomics data with extensive patient records and large patient cohorts promises diagnosis and potentially treatment to those with rare or undiagnosed diseases. In this project we will create novel methods and provide unique software tools that will meet this significant demand. Our methods are a departure from existing visualization approaches that are typically focused on visualizing particular molecular and clinical data types while neglecting the context of a patient cohort. Our proposed approach is distinguished from previous work by taking into account these complex relationships between patients in a cohort. In addition, our approach is the first to integrate genomic data at all scales while supporting the interactive analysis, creation and refinement of patient subsets. We will address this challenge by
-
developing visualization techniques, deeply integrated with algorithmic support, to identify and characterize disease subtypes. Specifically, we will develop methods that will allow clinical and experimental investigators to go beyond analyzing simple relationships, creating the potential to reveal the less obvious and indirect molecular causes of many diseases.
-
We will create novel visualizations that employ algorithms to select and display important genomic characteristics and the patient’s clinical history to study and diagnose rare diseases.
-
We will create a framework to support the development of web-based visual exploration tools, which we will use to create the visualizations for subtype and rare disease analysis.
Additionally, we will also make this framework available for the community to use for other tools. This will allow future projects to produce visual analysis methods that scale to the challenges of big data with less engineering overhead. This project will be a close collaboration between a team of computational (epi) genomics and cancer researchers in the laboratory of the Principal Investigator Peter Park at the Harvard Medical School and data visualization experts in the laboratory of the Co-Investigator Hanspeter Pfister at the Harvard School of Engineering and Applied Sciences. This team possesses the unique combination of expertise that is required to successfully address the challenges that motivate this application.
Publications
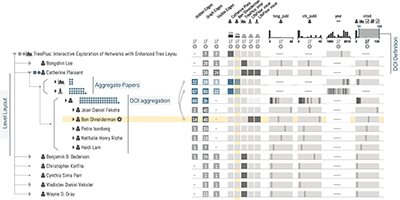
Juniper: A Tree+Table Approach to Multivariate Graph Visualization
IEEE Transactions on Visualization and Computer Graphics (InfoVis), 2019
From Visual Exploration to Storytelling and Back Again
Computer Graphics Forum (EuroVis), 2016
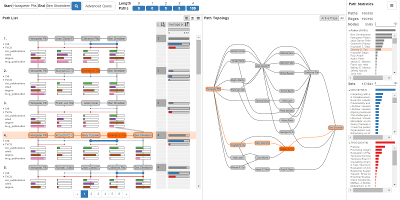
Pathfinder: Visual Analysis of Paths in Graphs
Computer Graphics Forum (EuroVis), 2016
EuroVis 2016 Honorable Mention Award
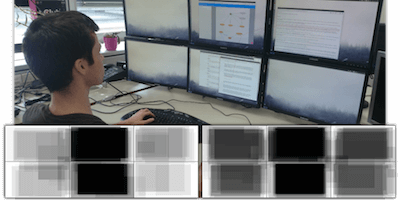
How Sensemaking Tools Influence Display Space Usage
EuroVis Workshop on Visual Analytics (EuroVA), 2017
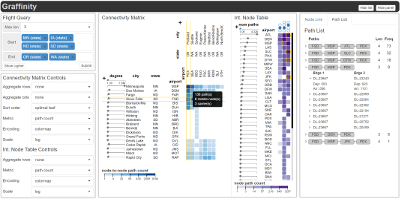
Graffinity: Visualizing Connectivity In Large Graphs
Computer Graphics Forum (EuroVis), 2017
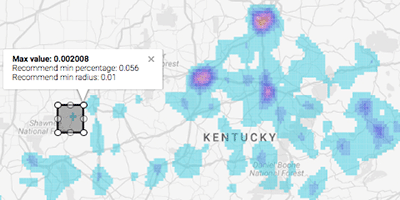
Visualization of Big Spatial Data using Coresets for Kernel Density Estimates
IEEE Symposium on Visualization in Data Science (VDS), 2017
Lineage: Visualizing Multivariate Clinical Data in Genealogy Graphs
IEEE Transactions on Visualization and Computer Graphics, 2019
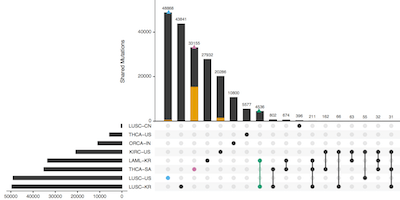
UpSetR: An R Package For The Visualization Of Intersecting Sets And Their Properties
Bioinformatics, 2017
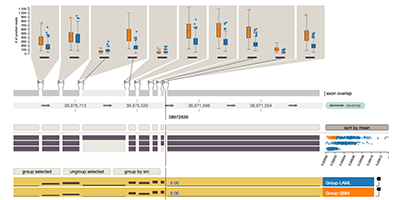
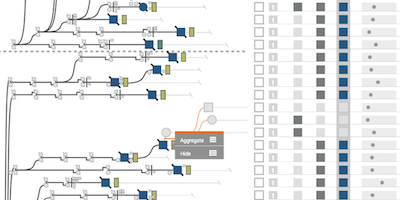
Vials: Visualizing Alternative Splicing of Genes
IEEE Transactions on Visualization and Computer Graphics (InfoVis ’15), 2016
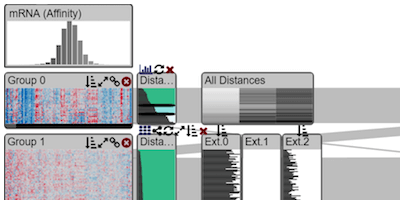
Interactive Visual Exploration And Refinement Of Cluster Assignments
BMC Bioinformatics, 2017