Abstract
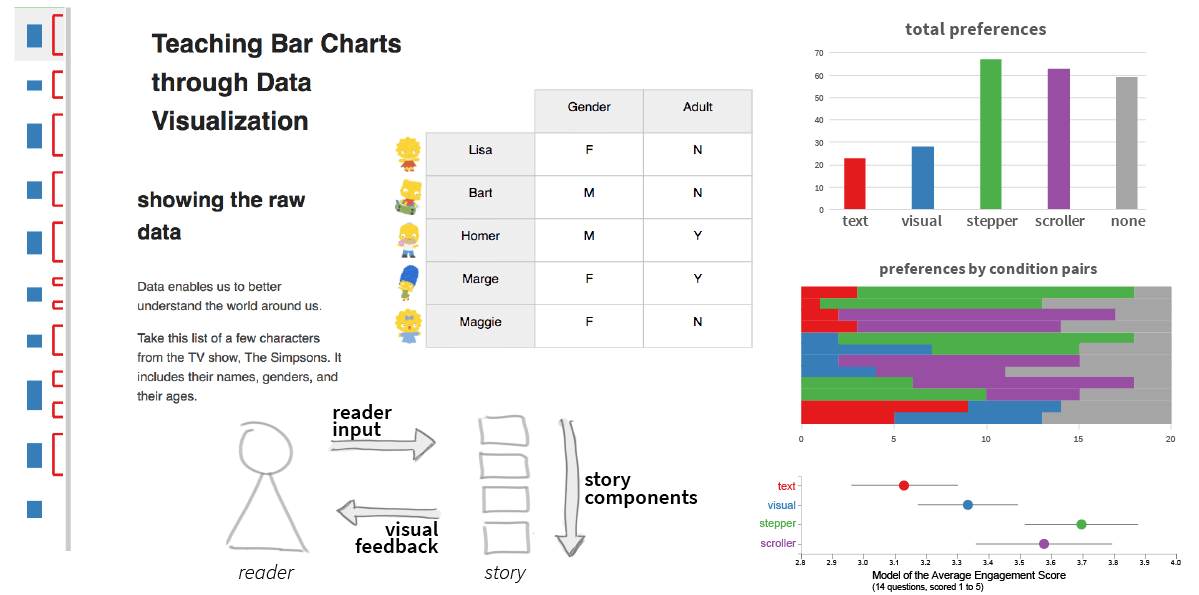
Many factors can shape the flow of visual data-driven stories, and thereby the way readers experience those stories. Through the analysis of 80 existing stories found on popular websites, we systematically investigate and identify seven characteristics of these stories, which we name “flow-factors,” and we illustrate how they feed into the broader concept of “visual narrative flow.” These flow-factors are navigation input, level of control, navigation progress, story layout, role of visualization, story progression, and navigation feedback. We also describe a series of studies we conducted, which shed initial light on how different visual narrative flows impact the reading experience. We report on two exploratory studies, in which we gathered reactions and preferences of readers for stepper- vs. scroller-driven flows. We then report on a crowdsourced study with 240 participants, in which we explore the effect of the combination of different flow-factors on readers’ engagement. Our results indicate that visuals and navigation feedback (e.g., static vs. animated transitions) have an impact on readers’ engagement, while level of control (e.g., discrete vs. continuous) may not.
Citation
Sean McKenna,
Nathalie Henry Riche,
Bongshin Lee,
Jeremy Boy,
Miriah Meyer
Visual Narrative Flow: Exploring Factors Shaping Data Visualization Story Reading Experiences
Computer Graphics Forum (EuroVis), 36(3): 377-387, doi:10.1111/cgf.13195, 2017.
BibTeX
@article{2017_eurovis_narrative-flow,
  title = {Visual Narrative Flow: Exploring Factors Shaping Data Visualization Story Reading Experiences},
  author = {Sean McKenna and Nathalie Henry Riche and Bongshin Lee and Jeremy Boy and Miriah Meyer},
  journal = {Computer Graphics Forum (EuroVis)},
  doi = {10.1111/cgf.13195},
  volume = {36},
  number = {3},
  pages = {377-387},
  year = {2017}
}