Ferret — Catching Scientific Fraud with Data Visualizations

Ferrets search data
Alas, artifacts abound
Manipulation

Imagine I had a time machine, and for the sake of this blog, I decided to tell Past-Devin that he would be working on a research project to determine if scientific datasets were manipulated or not. I’m pretty sure Past-Devin’s reaction would be, “ok, cool, but is it really common for scientists to just make up data?” At the time, I had high confidence that scientists act in good faith and would never fabricate data. Since then, I’ve been exposed to a number of academic scandals that have made the news circuit. Whether it’s the behavior of spiders or, ironically, a study on honesty, these problematic datasets seem more common than I thought was possible. Despite these stories, I believe that scientists are generally honest and do their best to expand human knowledge and improve society. However, with cases such as the fraudulent Alzheimer’s research that led to 15 years of misguided scientific effort and the development of dubious medications, it seems vital to increase vigilance against these bad actors.
The story of Dr. Kate Laskowski was especially inspirational for my project. As an early career faculty member, she began a collaboration with a prominent member of her field, who provided a tabular dataset that they used in a publication. Later, she determined that the data could not be trusted. She found strong signs that the data was manipulated. In this incredibly difficult situation, she decided to publish her story. Her story also includes rich details about the “data forensics” required to investigate a tabular dataset for fraud. Seeing the patterns and methods used in this case showed me two ways that I could help with the process. First, in hindsight, some of the patterns left behind by manipulation may seem very obvious, but Dr. Laskowsi and others agree that “until you know what to look for, the patterns are not obvious.” Second, although it is possible to find these patterns in existing tools like Excel, it can be quite laborious.
To help identify cases like this more readily, I started a research project. First, I collected and organized common patterns that arise when data has been manipulated, which I call Artifacts of Manipulation. Second, I developed design guidelines for visualization tools that help identify these patterns. Finally, I implemented Ferret, an open source tool based on these guidelines. If you are wondering why I named my tool after ugly cute rodents (members of the weasel family)1, it’s because it helps ferret out the truth in datasets. And I like to name my tools after cute animals. But mostly the former.
Artifacts of Manipulation
To identify common artifacts of manipulation, I collected tabular datasets associated with papers that have been retracted. For each of these, I reviewed the reason for the retraction, as well as public discussions on blogs/forums that led to the paper’s retraction. I then organized these patterns into eight categories:
-
Unexpected Formatting: Spreadsheet tools such as Microsoft Excel allow the appearance of cells to be formatted in different ways, such as font, font sizes, colors, text emphasis, etc. In some datasets I examined, a variation in this formatting seems to indicate that data was manipulated in one spreadsheet then copied to a main spreadsheet, resulting in a strange mix of formatting.
-
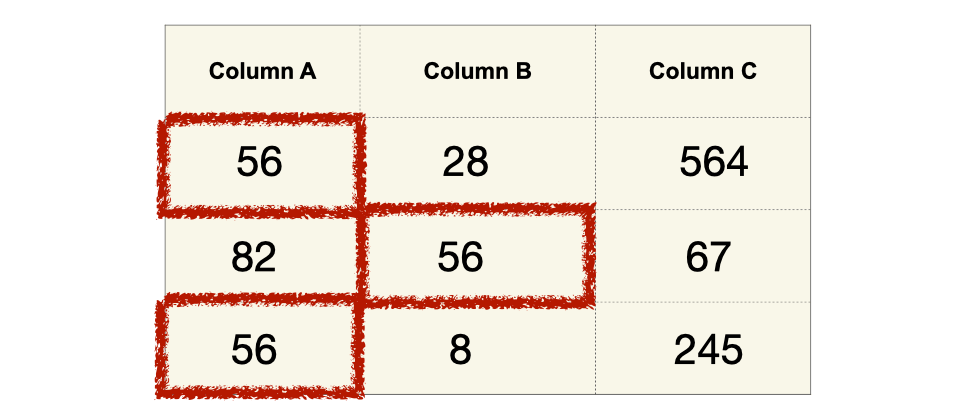
Duplicate Numbers and Digits: If data is manually generated simply by typing “random” numbers, I expect there to be a higher number of repeated numbers (e.g., 123) or digits (e.g., 12 or 23, in 123) since humans are generally not good random number generators.
-
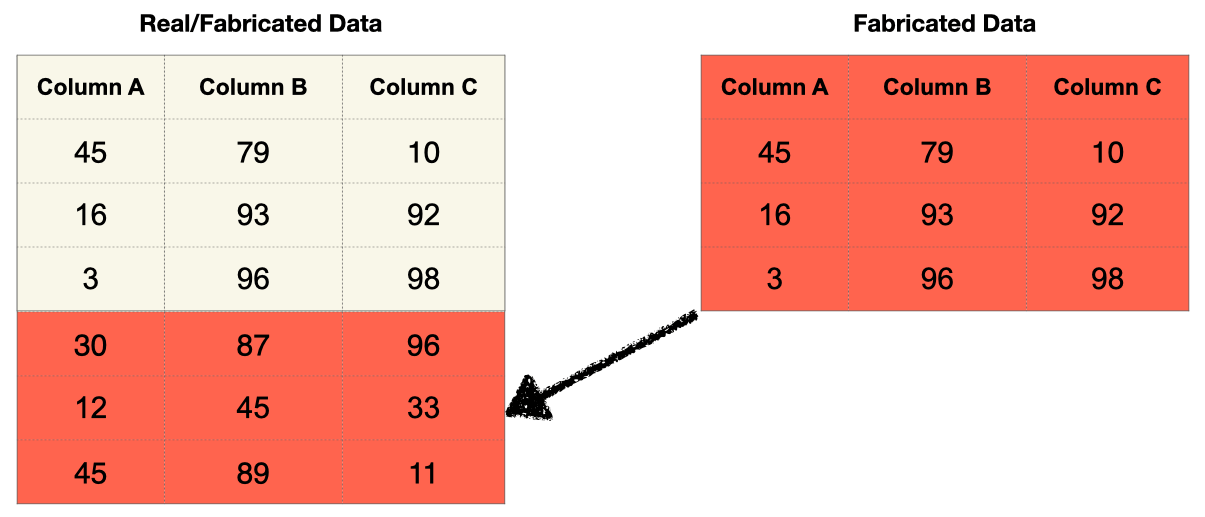
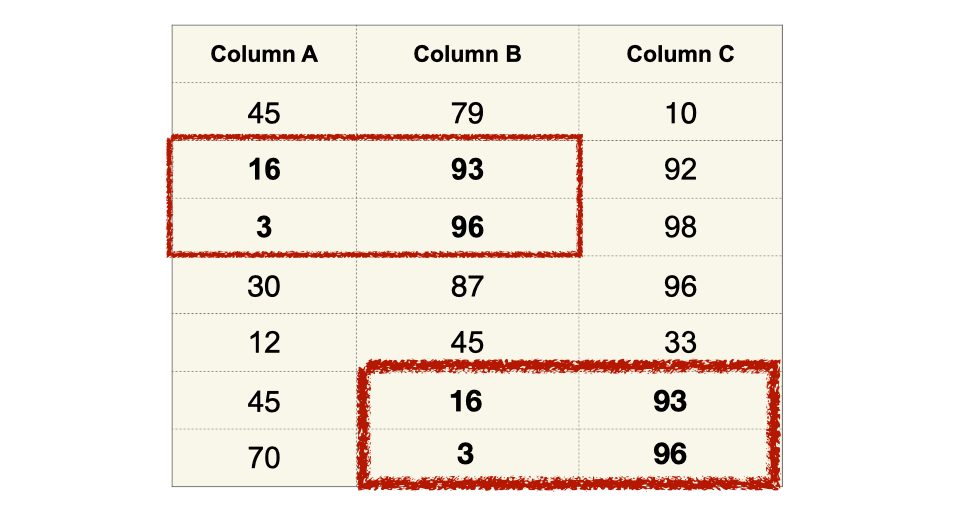
Repeated Regions: Similar to repeated numbers, entire regions of data may be duplicated. This can occur if copy/pasting regions were used to create or augment a manipulated dataset.
-
Unexpected Leading Digits: Depending on the data, there may be an expected distribution of the leading digit of numbers. In particular, Benford’s law has been used to find fraud in financial datasets.
-
Unexpected Trailing Digits: The distribution of the last digit can also reveal interesting aspects of the data. For example, in some datasets I examined, this distribution revealed different rounding effects of numbers.
-
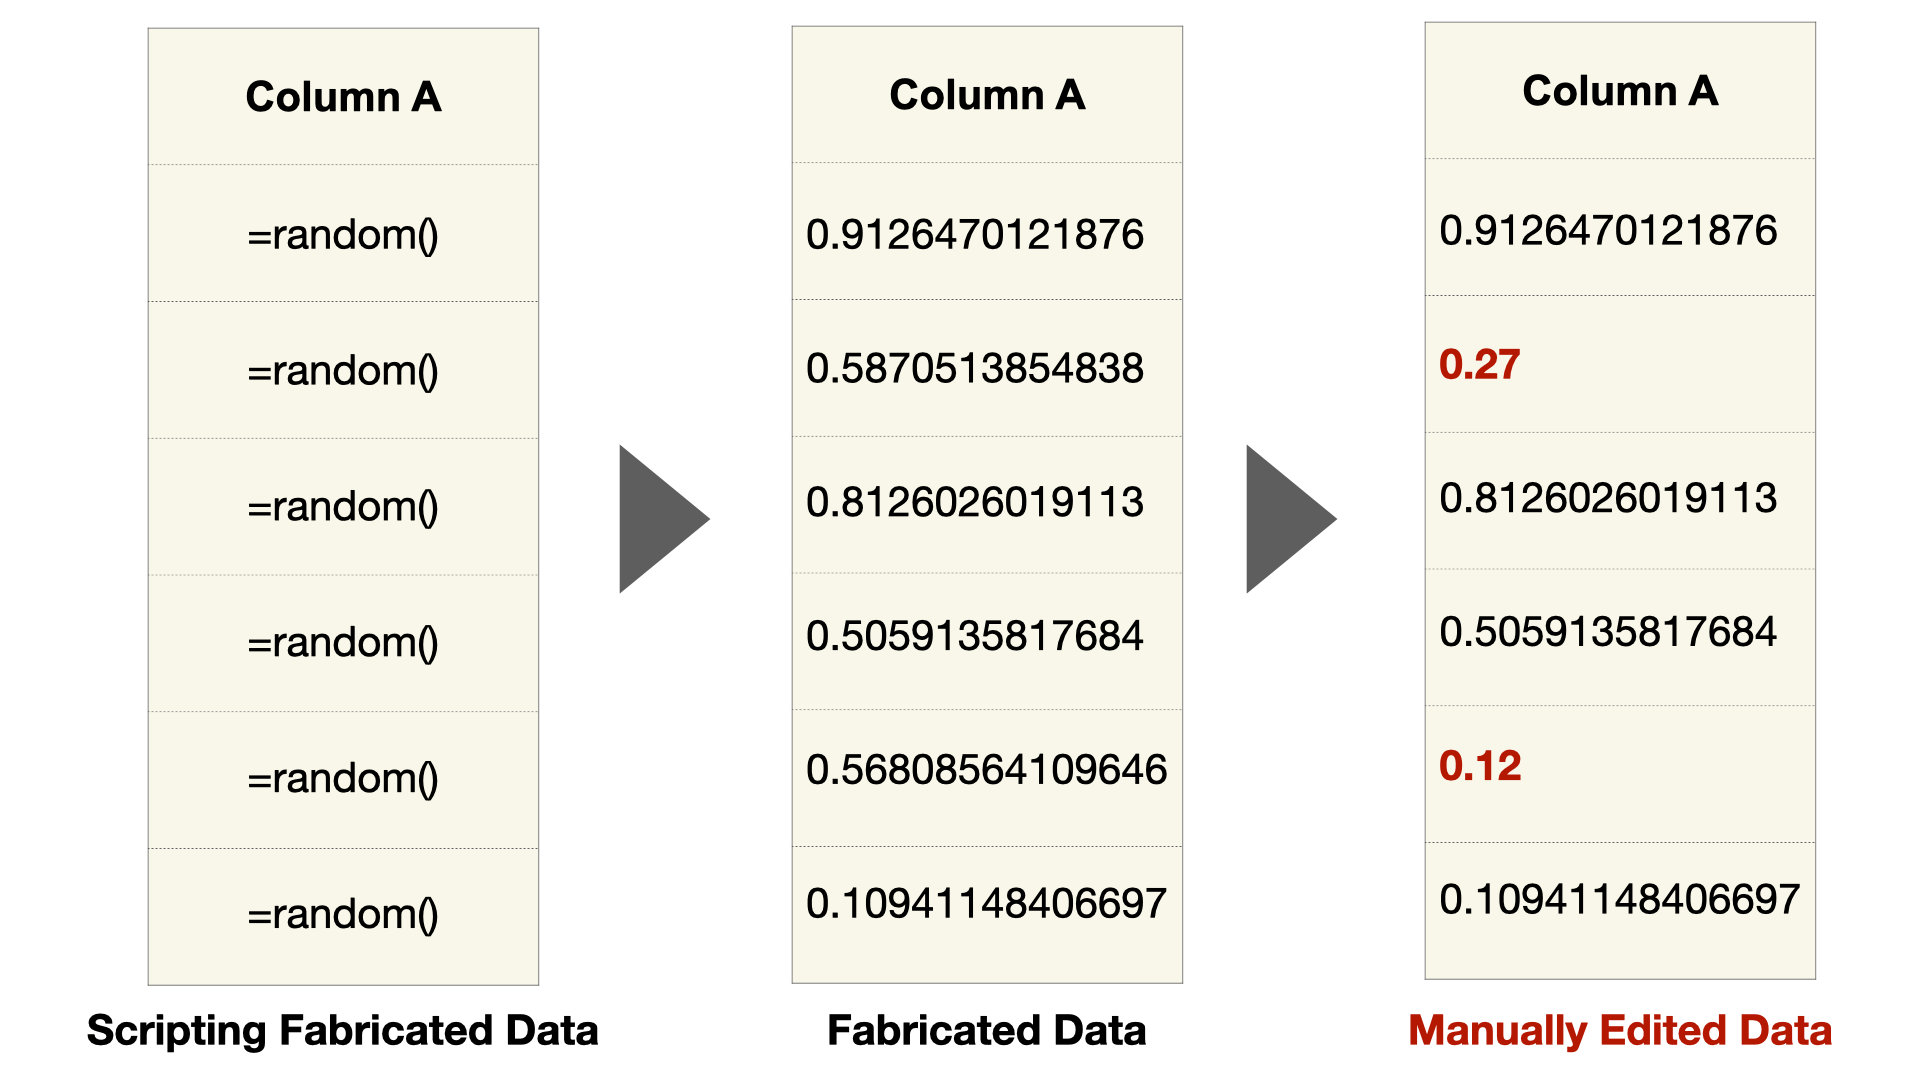
Unexpected Variation of Precision: I refer to the number of digits recorded after zero as the precision. One way strange variations of precision can occur is if data is generated by a script with high precision and then modified by hand to manipulate the data toward a desired outcome. This is obvious in the images below but may not be immediately obvious in a program like Excel, which only displays 2 digits of precision by default.
-
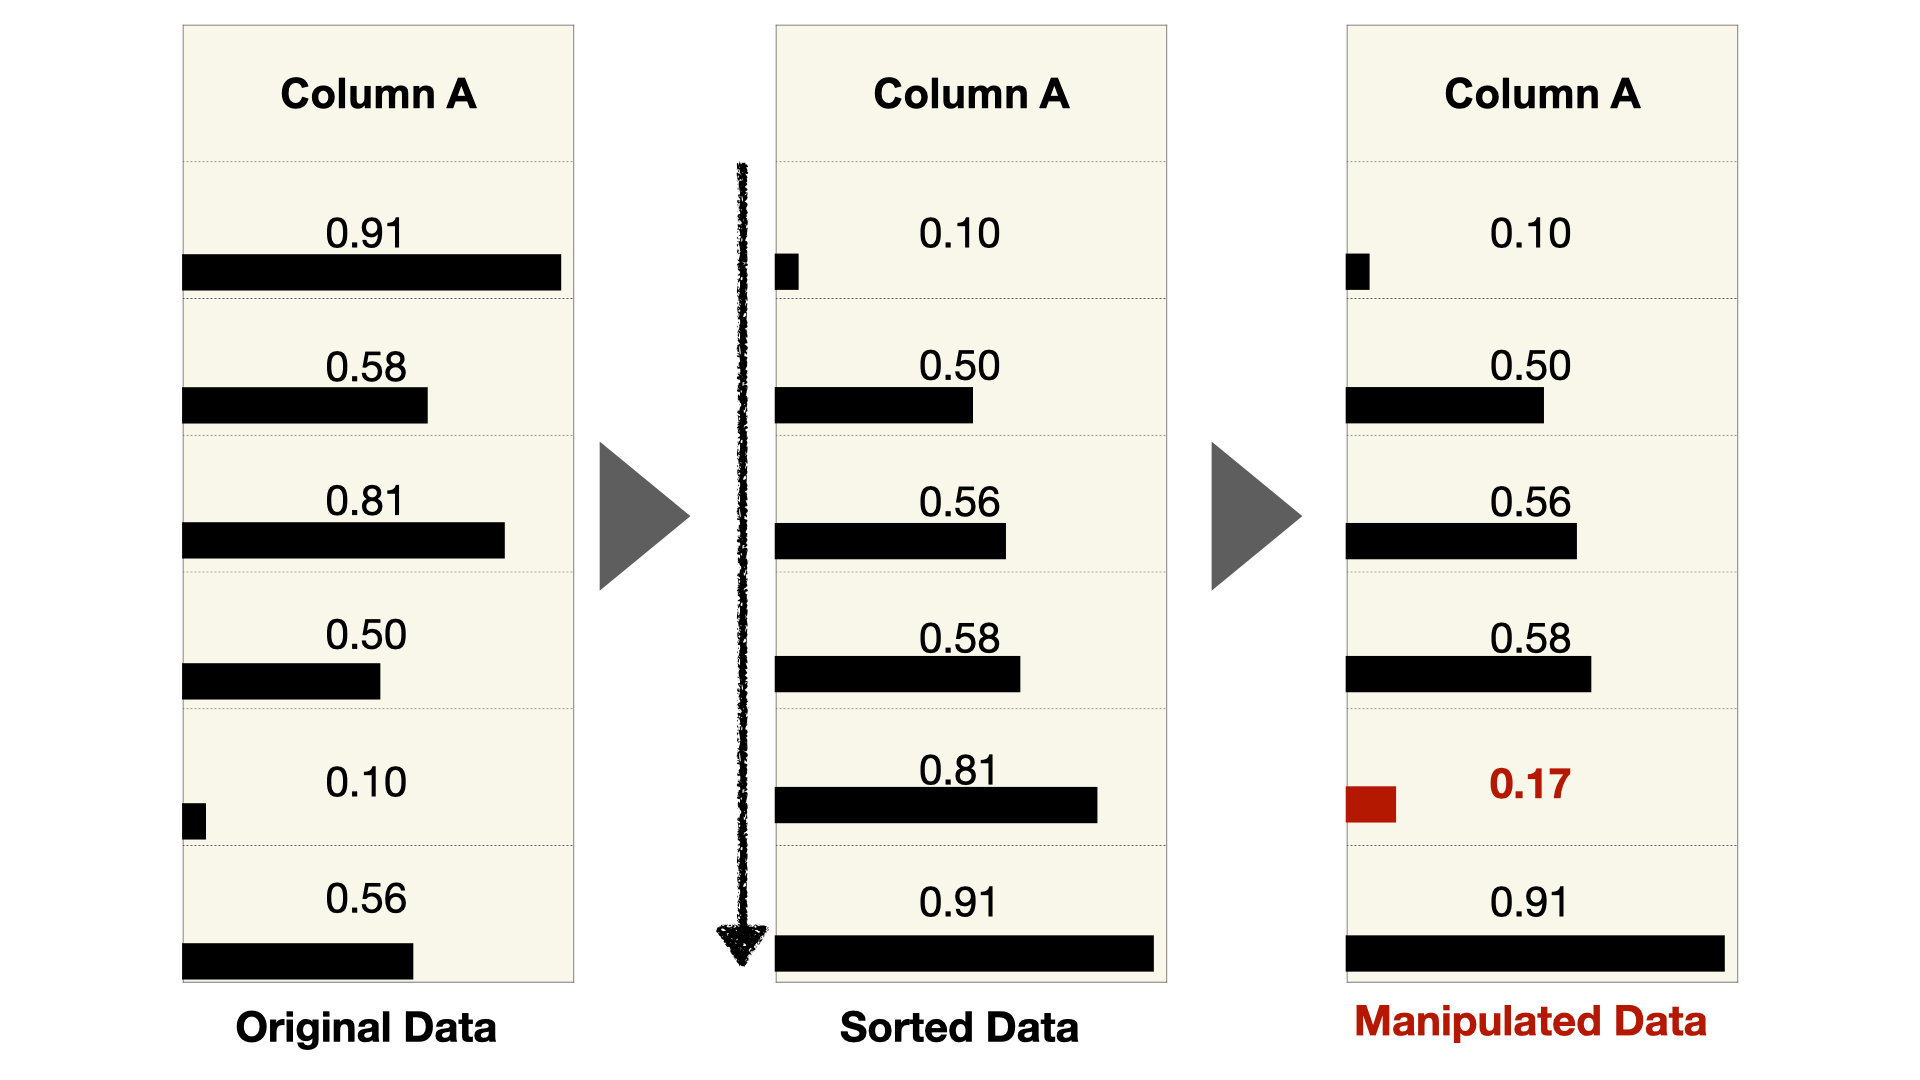
Ordering Artifacts: The ordering of data can hint at inappropriate manipulations of data. One way authors could manipulate data is to first sort it and then modify the largest and smallest values. Changing these extreme values will have the largest impact on the effect they are trying to create. However, this may result in strange, almost perfectly-sorted lists, where the “almost” hints at manipulation.
-
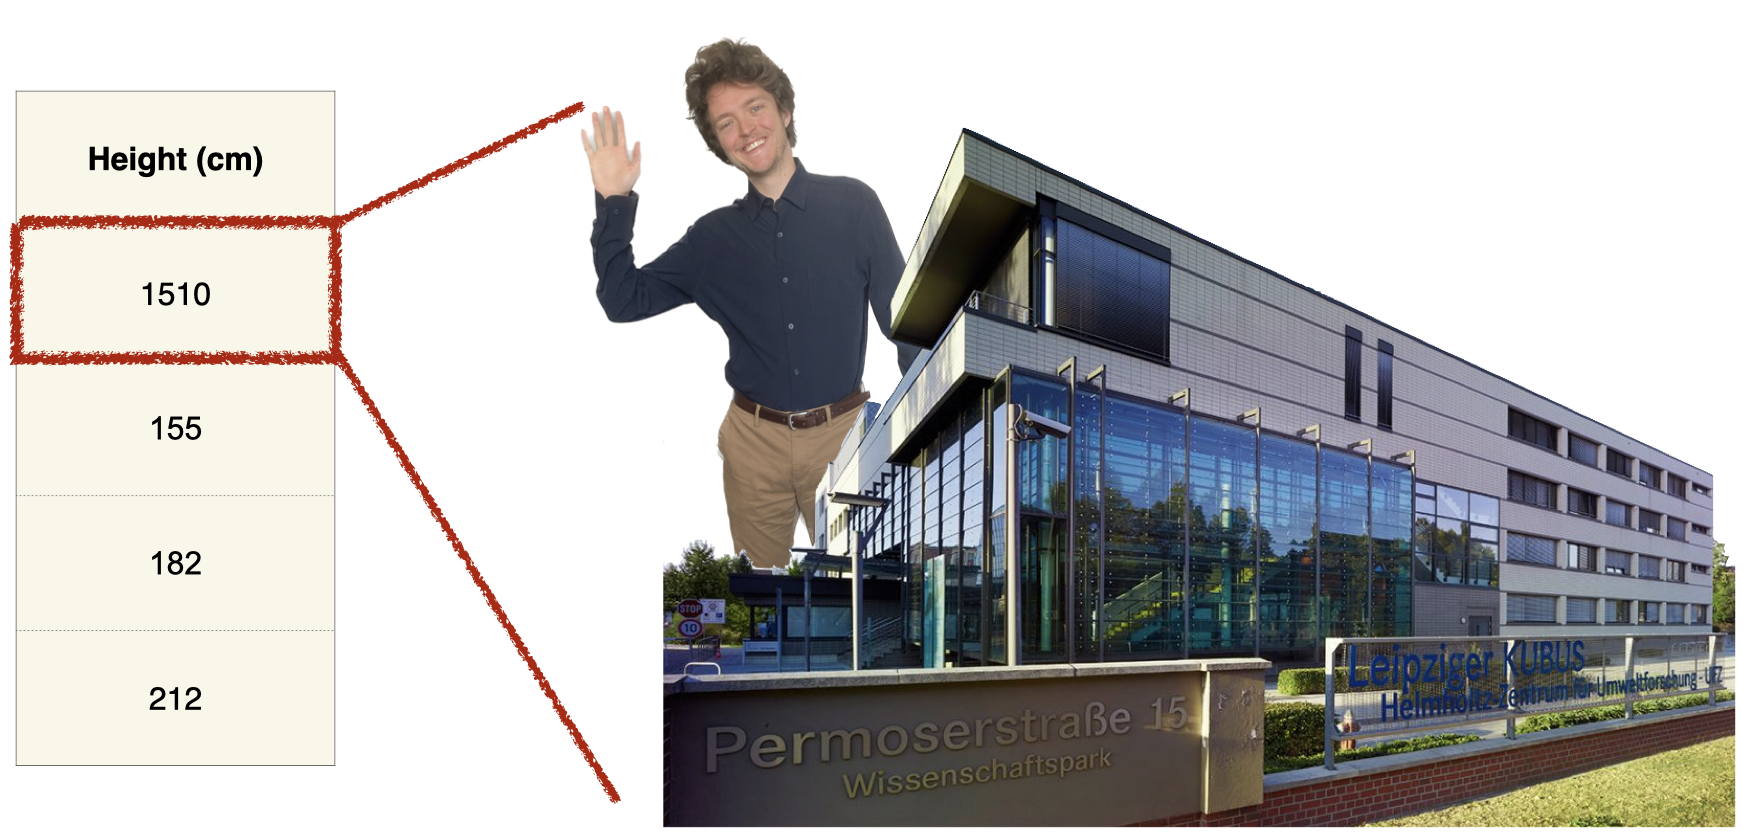
Deviation from Domain Expectations: For most datasets, researchers have an idea about what values they can expect. A deviation from this expectation can be something very simple, like an impossibly large value, such as a height of 15 meters (or 50 feet) for a human. Of course, there are also more complex deviations from domain expectations, such as unexpected distributions of values or correlations between items.
Since these artifacts are based on currently retracted datasets, future retractions may reveal additional patterns. Therefore, I created a living document that includes our current list of artifacts but also invites suggestions for edits or additions.
You may notice that many of these artifacts feel a little “squishy.” Many contain the “unexpected” qualifier, and this is by design. I believe it is somewhere between very difficult and impossible to create algorithmic tests for these kinds of data artifacts that can be applied in all situations. In my analysis of datasets, I have encountered cases that look suspicious at first but then turn out to be benign. For example, the Unexpected Variation of Precision example I gave above included data with a precision of 15 and 2. A simple test could be created that checks for such a pattern and flags it as problematic. But what if your data looks like this?
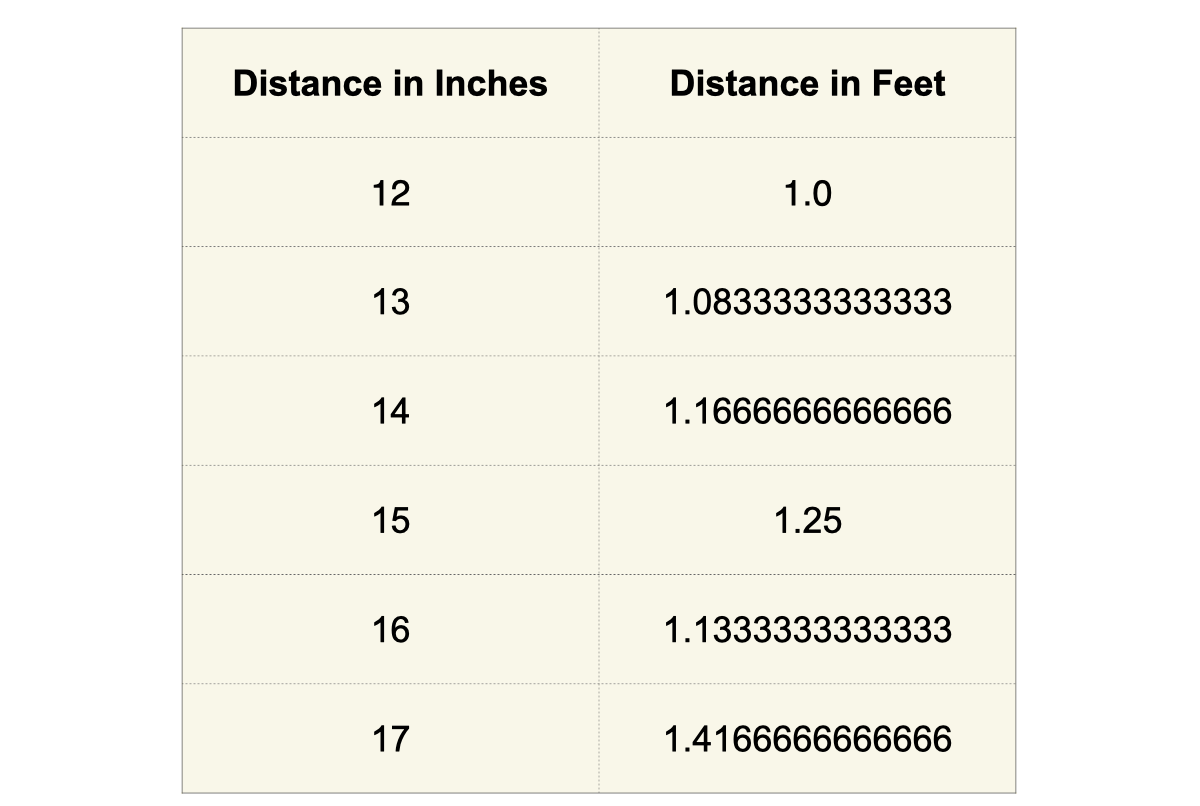
A conversion from integers to fractions produces a suspicious mix of high-precision and low-precision numbers. To account for this, a simple test should also determine if the data appears to have been converted to a fraction. While this might still be doable, consider this example.
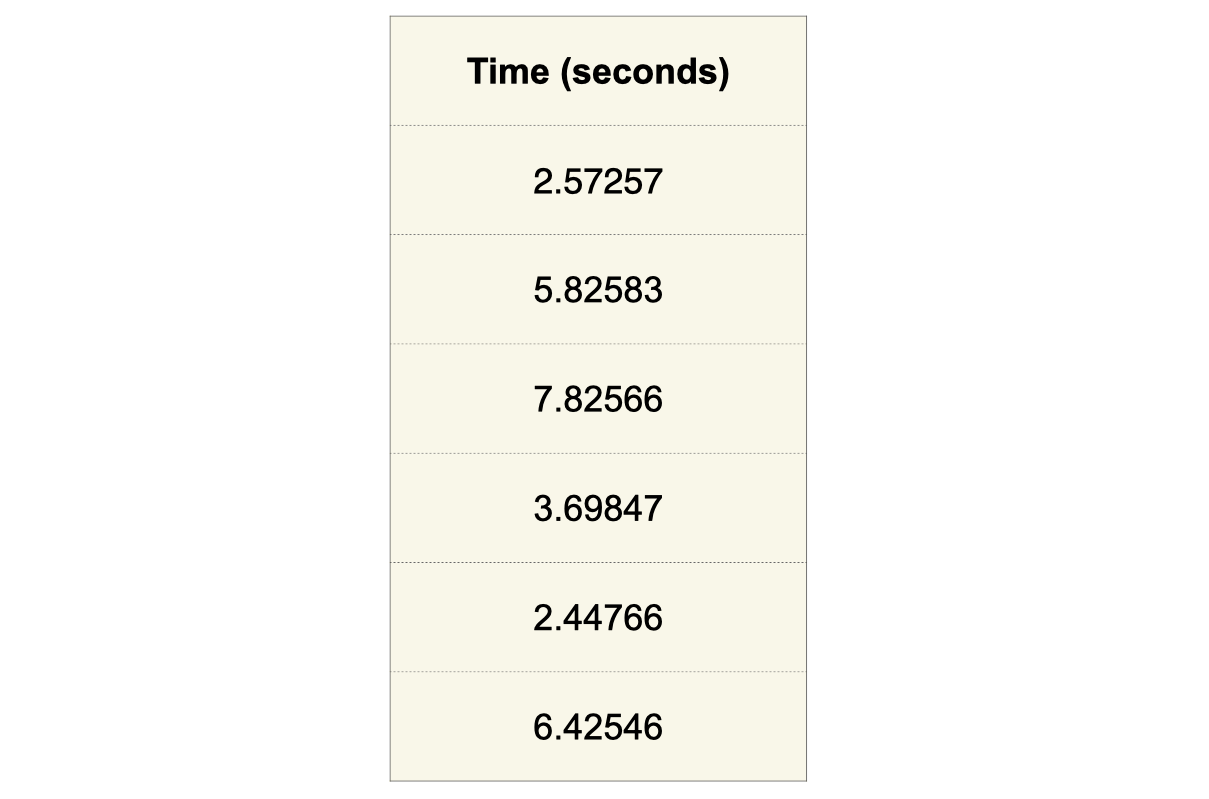
Here, all values have five digits of precision. But what if I told you that the data was recorded by a human using a stopwatch? What if I told you it was recorded automatically with a high-precision digital device? To make a determination about whether this is reasonable would require information not present in the dataset, such as the recording methodology. This is a simple artificial example, but it extends to real scenarios. I believe that it’s imperative to review a dataset while also considering the methodology reported in a manuscript. It also often requires human domain expertise and may even include communication with authors for clarification about the data. In short, determining if a dataset has been manipulated is complex and multifaceted and requires a human investigator.
Even though this process cannot be fully automated, investigators can still benefit from better tools. Similar to how there are purpose-built tools for the detection of plagiarism in text, there should be such tools for investigating manipulation in tabular datasets. I have developed Ferret to fill this need.
Ferret: Visualization Prototype
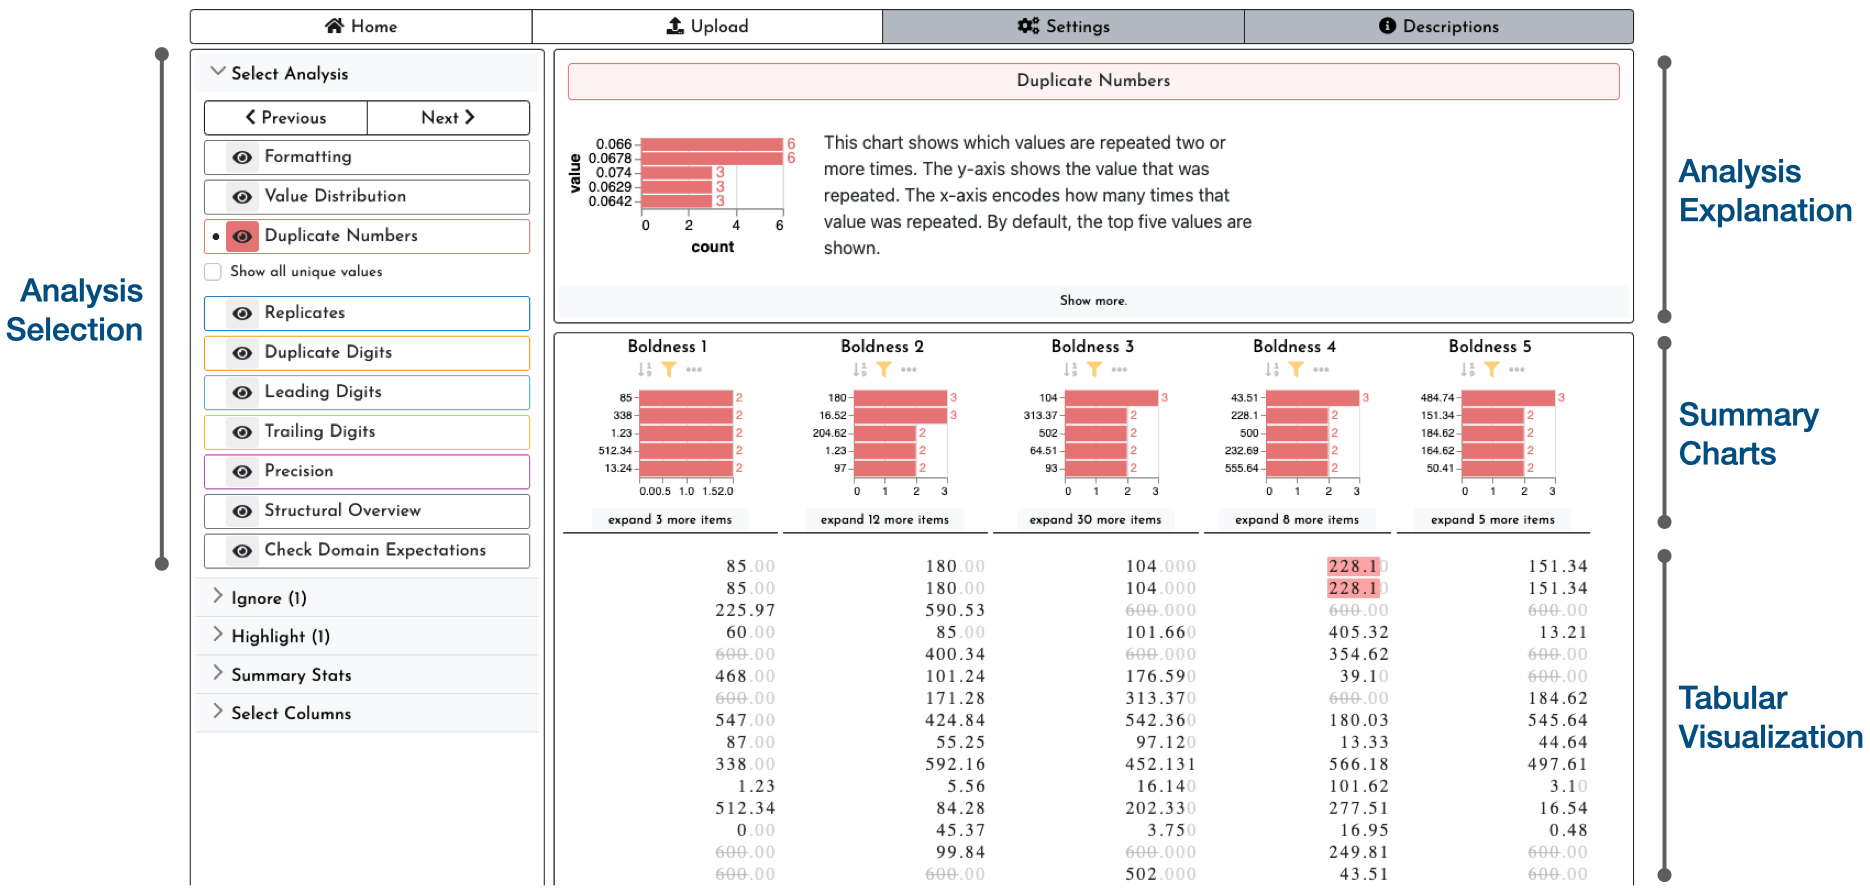
The design of Ferret mirrors the list of artifacts of manipulation. It includes a selection of analysis methods, each of which is designed to help highlight an artifact. In the image below, the selected analysis highlights duplicate numbers. Ferret is designed to caution analysts about possible benign sources of artifacts and also instructs them on how to spot problematic data. These details are shown in the analysis explanation window. The visualization is split between summary charts that give an analysis-specific overview of patterns and a tabular visualization of raw values. When designing the tabular display, I made design choices to highlight artifacts of manipulation. For instance, numbers are aligned by the decimal point and will always show all digits of precision included in the data, so that variations in precision can be easily spotted. There’s a lot more I could talk about with respect to visualization design, but to keep it short, I’ll let you discover this in the tool yourself or read about the details in the paper.
Ethical Considerations
For work of this nature, it is especially important to consider the ethical implications. An obvious concern are false accusations that may arise when reviewing datasets with Ferret. False accusations may have the potential to derail a career. To limit this problem, I believe that the paper review process is the best place for my tool to be used. If done carefully, authors can have an opportunity to respond to questions about their data and provide clarifications.
Another concern is that people who are manipulating data could use Ferret to make them harder to detect. While some bad actors may do this, the same argument can be made for plagiarism detection tools, and yet they still catch instances of plagiarism year after year after year. However, I hope that making it clear that artifacts of manipulation can be detected may deter authors from manipulating their data in the first place. Conclusion While I believe that most scientists do work hard to improve society, this project has revealed the unfortunate reality that some cheat. We, as a scientific community, can and should do more to prevent this from happening. I have taken an initial step to help prevent the manipulation of tabular datasets with my work and encourage you to consider how you could do the same.
Try Out Ferret
If I’ve piqued your interest, make sure to head over to the Ferret page to try out the tool yourself!
Corrections
The Paper
This blog post is based on the following paper:
Ferret: Reviewing Tabular Datasets for Manipulation
Computer Graphics Forum (EuroVis), 2023