Abstract
Reproducibility and justifiability are widely recognized as critical aspects of data-driven decision making in fields as varied as scientific research, business, healthcare, or intelligence analysis. This project is concerned with enabling reproducibility and justifiability of decisions in the data analysis process, specifically as it relates to visual data analysis. Visualization is an important tool for discovery, yet decisions made by humans based on visualizations of data are difficult to capture and to justify. This project will develop methods to justify, communicate, and audit decisions made based on visual analysis. This, in turn will lead to better outcomes, achieved with less effort and cost. The increasing use of visual analysis tools for decision making will make data analysis accessible to a broad variety of people, as visual analysis tools are generally easier to use than scripting languages and do not require extensive computational and statistical training. This research and its related activities increase accessibility and enhance the data analysis infrastructure for research and education.
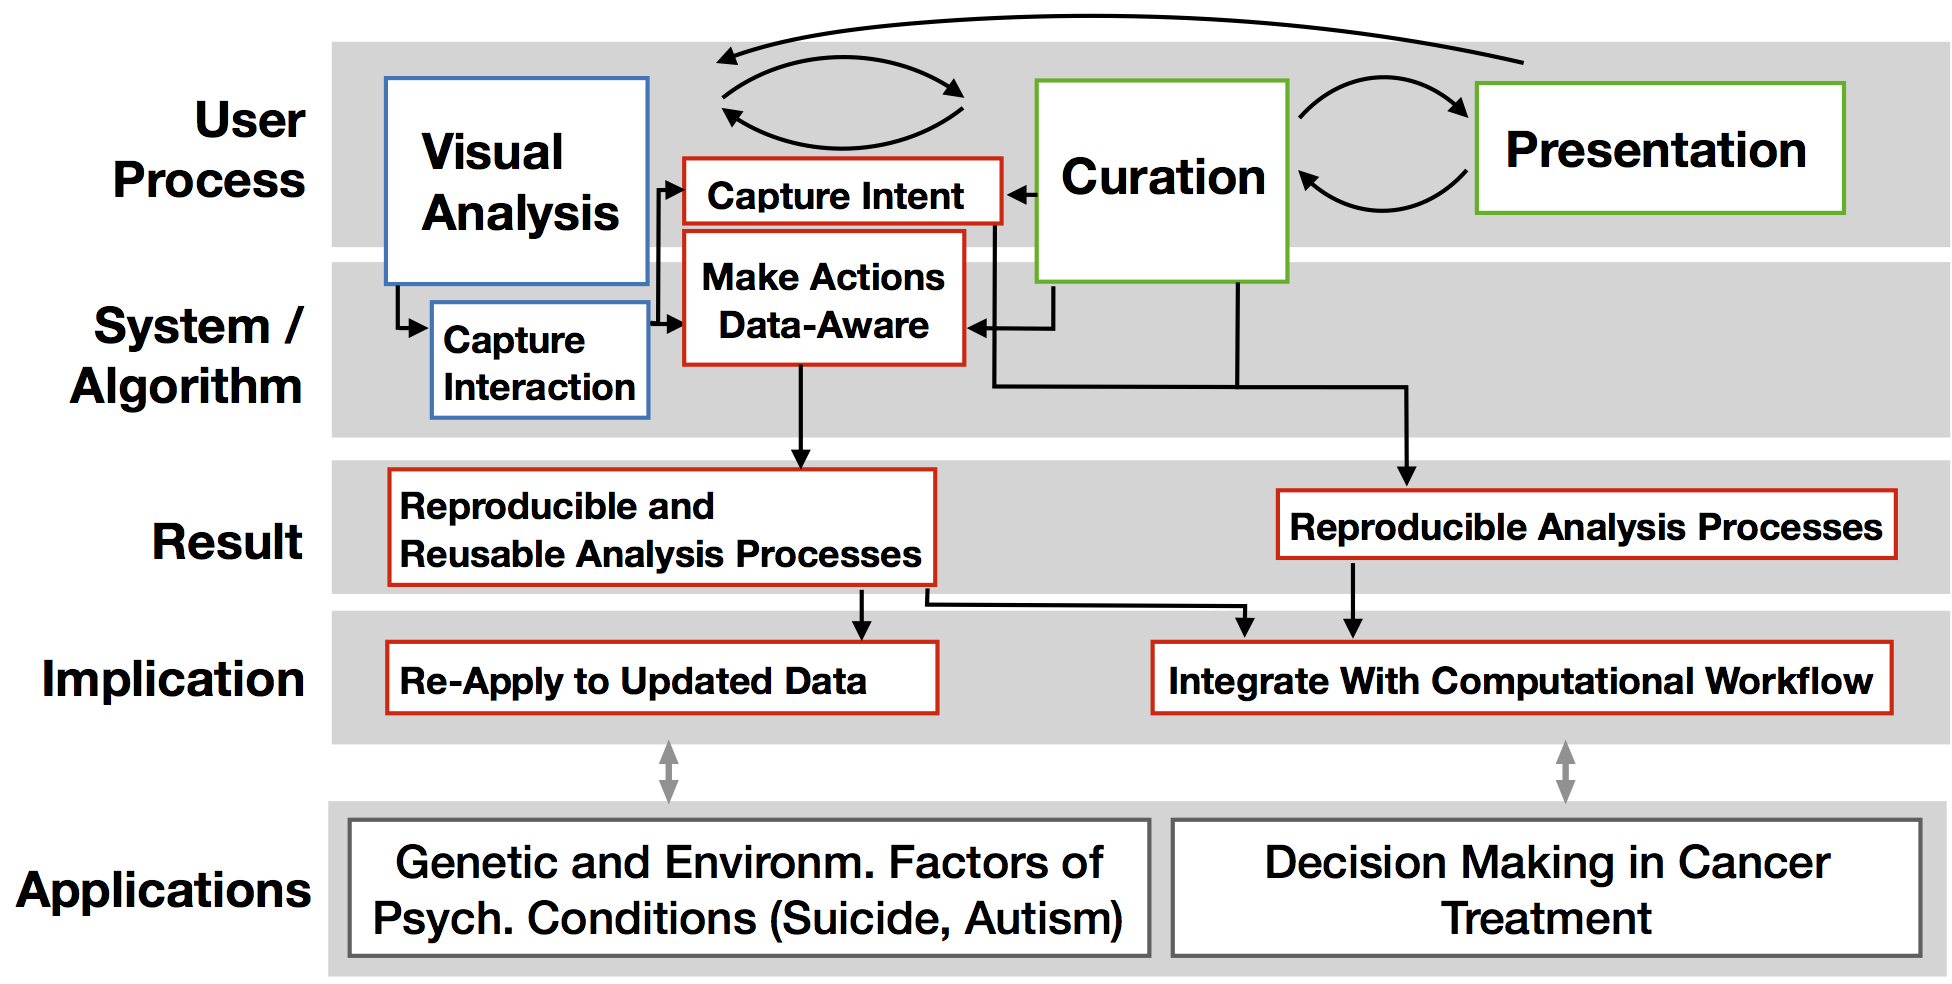
To achieve these goals, this research will develop a framework for making visual analysis sessions not only reproducible but also reusable. The approach is based on tracking semantically meaningful provenance data during an interactive visual analysis session. Once a discovery is made, analysts can use this history to curate a succinct analysis story, adding justifications and explanations to make their analysis reproducible by others. Using a semi-automatic process, analysts will be able to make their actions data-aware, so that their analysis processes become robust to changes, such as updates in the data. A second contribution of the proposed work is the integration of visual analysis into computational analysis processes. While visualization is commonly used to present computational analysis results, the results of a visual analysis session are rarely used to feed into further computational processes. The techniques developed in this project will allow analysts to feed analysis results (selections, aggregations, filters, etc.) back into a computational environment. This will make it possible to use interactive visualization at any point in the data analysis process while maintaining reproducibility and enabling reuse. The expected results include new methods to capture user intent, create data stories from analysis processes, and to integrate computational and visual data analysis, leveraging the strength of both, human abilities and computational power. The results will be disseminated in publications and in the form of open source software, and accessible via this website.
Software
We are developing a provenance tracking library for integration with web applications. The source code is available here, and a blog post is also available.
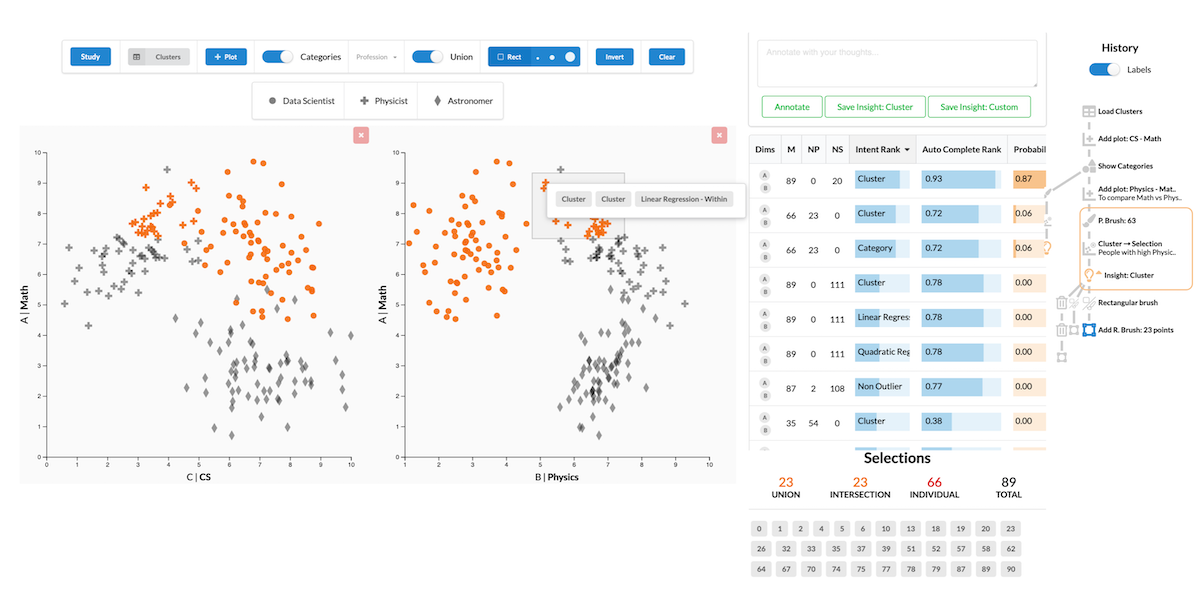
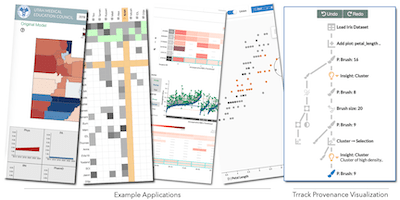
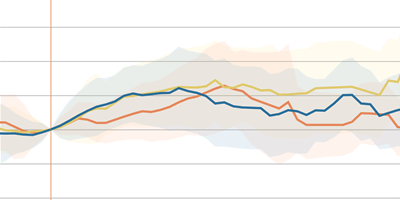
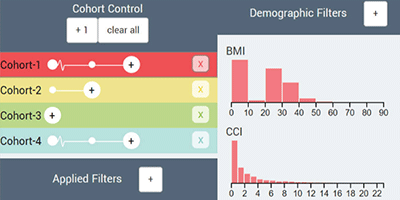
We are also working on a visualization tool to capture analysis intent using the provenance library discussed above. Find the code here, and a live-demo of the system at this page.
The following image illustrates the interface:
Check out the two core paper for this project, on predicting intent and reusing workflows.
Publications
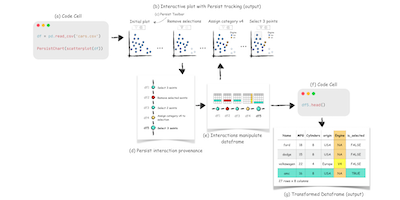
Persist: Persistent and Reusable Interactions in Computational Notebooks
Computer Graphics Forum (EuroVis), 2024
Ferret: Reviewing Tabular Datasets for Manipulation
Computer Graphics Forum (EuroVis), 2023
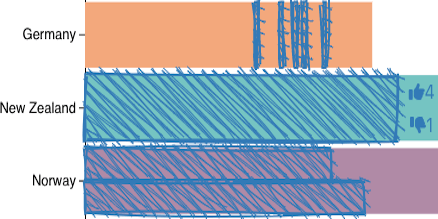
Data Hunches: Incorporating Personal Knowledge into Visualizations
IEEE Transactions on Visualization and Computer Graphics (VIS), 2022

Reusing Interactive Analysis Workflows
Computer Graphics Forum (EuroVis), 2022
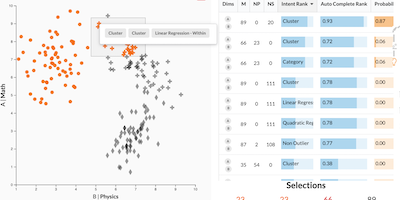
Predicting Intent Behind Selections in Scatterplot Visualizations
Information Visualization, 2021
reVISit: Looking Under the Hood of Interactive Visualization Studies
SIGCHI Conference on Human Factors in Computing Systems (CHI), 2021
Trrack: A Library for Provenance-Tracking in Web-Based Visualizations
IEEE Visualization Conference (VIS), 2020
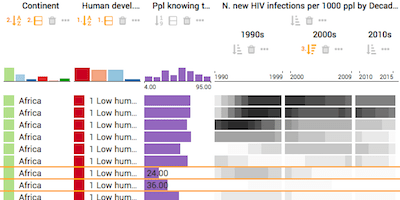
Taggle: Scalable Visualization of Tabular Data through Aggregation
Information Visualization, 2019
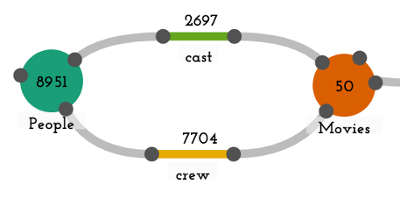
Origraph: Interactive Network Wrangling
IEEE Conference on Visual Analytics Science and Technology (VAST), 2019
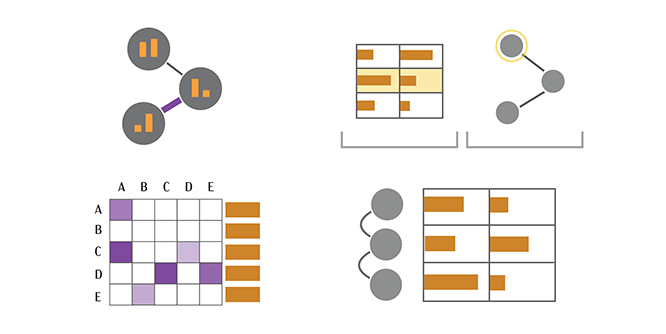
The State of the Art in Visualizing Multivariate Networks
Computer Graphics Forum (EuroVis), 2019
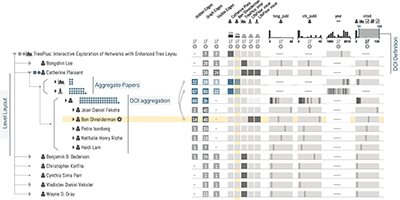
Juniper: A Tree+Table Approach to Multivariate Graph Visualization
IEEE Transactions on Visualization and Computer Graphics (InfoVis), 2019
Composer: Visual Cohort Analysis of Patient Outcomes
Applied Clinical Informatics, 2019
Composer: Visual Cohort Analysis of Patient Outcomes
Workshop on Visual Analytics in Healthcare at AMIA (VAHC 2018), 2018
VDL Project Staff


VDL Project Alumni
- Jen Rogers
- Zach Cutler
- Hannah Bruns
- Jochen Görtler
- Pranav Rajan