Abstract
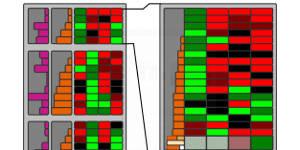
Expression analysis of ∼omics data using microarrays has become a standard procedure in the life sciences. However, microarrays are subject to technical limitations and errors, which render the data gathered likely to be uncertain. While a number of approaches exist to target this uncertainty statistically, it is hardly ever even shown when the data is visualized using for example clustered heatmaps. Yet, this is highly useful when trying not to omit data that is “good enough” for an analysis, which otherwise would be discarded as too unreliable by established conservative thresholds. Our approach addresses this shortcoming by first identifying the margin above the error threshold of uncertain, yet possibly still useful data. It then displays this uncertain data in the context of the valid data by enhancing a clustered heatmap. We employ different visual representations for the different kinds of uncertainty involved. Finally, it lets the user interactively adjust the thresholds, giving visual feedback in the heatmap representation, so that an informed choice on which thresholds to use can be made instead of applying the usual rule-of-thumb cut-offs. We exemplify the usefulness of our concept by giving details for a concrete use case from our partners at the Medical University of Graz, thereby demonstrating our implementation of the general approach.
Citation
Clemens Holzhüter,
Alexander Lex,
Dieter Schmalstieg,
Hans-Jörg Schulz,
Heidrun Schumann,
Marc Streit
Visualizing Uncertainty in Biological Expression Data
Proceedings of the SPIE Conference on Visualization and Data Analysis (VDA), 8294: 82940O-82940O-11, doi:10.1117/12.908516, 2012.
BibTeX
@inproceedings{2012_vda_uncertainty,
  title = {Visualizing Uncertainty in Biological Expression Data},
  author = {Clemens Holzhüter and Alexander Lex and Dieter Schmalstieg and Hans-Jörg Schulz and Heidrun Schumann and Marc Streit},
  booktitle = {Proceedings of the SPIE Conference on Visualization and Data Analysis (VDA)},
  doi = {10.1117/12.908516},
  volume = {8294},
  pages = {82940O-82940O-11},
  year = {2012}
}