Abstract
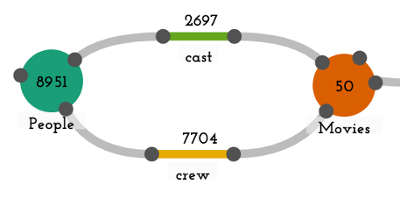
Multivariate networks – datasets that link together entities that are associated with multiple different variables – are a critical data representation for a range of high-impact problems, from understanding how our bodies work to uncovering how social media influences society. These data representations are a rich and complex reflection of the multifaceted relationships that exist in the world. Reasoning about a problem using a multivariate network allows an analyst to ask questions beyond those about explicit connectivity alone: Do groups of social-media influencers have similar backgrounds or experiences? Do species that co-evolve live in similar climates? What patterns of cell-types support different types of brain functions? Questions like these require understanding patterns and trends about entities with respect to both their attributes and their connectivity, leading to inferences about relationships beyond the initial network structure. As data continues to become an increasingly important driver of scientific discovery, datasets of networks have also become increasingly complex. These networks capture information about relationships between entities as well as attributes of the entities and the connections. Tools used in practice today provide very limited support for reasoning about networks and are also limited in the how users can interact with them. This lack of support leaves analysts and scientists to piece together workflows using separate tools, and significant amounts of programming, especially in the data preparation step. This project aims fill this critical gap in the existing cyber-infrastructure ecosystem for reasoning about multivariate networks by developing MultiNet, a robust, flexible, secure, and sustainable open-source visual analysis system.
MultiNet aims to change the landscape of visual analysis capabilities for reasoning about and analyzing multivariate networks. The web-based tool, along with an underlying plug-in-based framework, will support three core capabilities:
- interactive, task-driven visualization of both the connectivity and attributes of networks,
- reshaping the underlying network structure to bring the network into a shape that is well suited to address analysis questions, and
- leveraging provenance data to support reproducibility, communication, and integration in computational workflows.
These capabilities will allow scientists to ask new classes of questions about network datasets, and lead to insights about a wide range of pressing topics. To meet this goal, we will ground the design of MultiNet in four deeply collaborative case studies with domain scientists in biology, neuroscience, sociology, and geology.
Software
Multinet is web-based, open-source software. You can find the interactive application at:
The source code for the projects is available at:
Origraph, our network wrangling prototype is available at:
Our ranking method for multivariate network visualization techniques is available at:
Publications
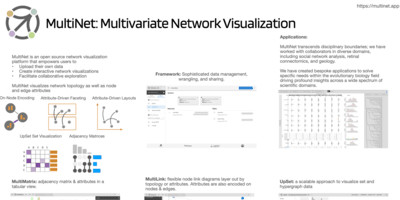
MultiNet: Multivariate Network Visualization
NSF CSSI PI Meeting, 2023
Troubling Collaboration: Matters of Care for Visualization Design Study
SIGCHI Conference on Human Factors in Computing Systems (CHI), 2023
Data Hunches: Incorporating Personal Knowledge into Visualizations
IEEE Transactions on Visualization and Computer Graphics (VIS), 2022
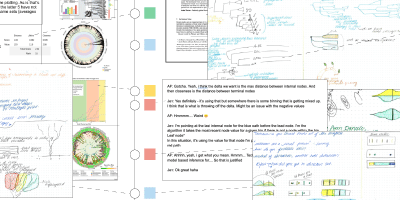
reVISit: Looking Under the Hood of Interactive Visualization Studies
SIGCHI Conference on Human Factors in Computing Systems (CHI), 2021
Insights From Experiments With Rigor in an EvoBio Design Study
IEEE Transactions on Visualization and Computer Graphics (InfoVis), 2021
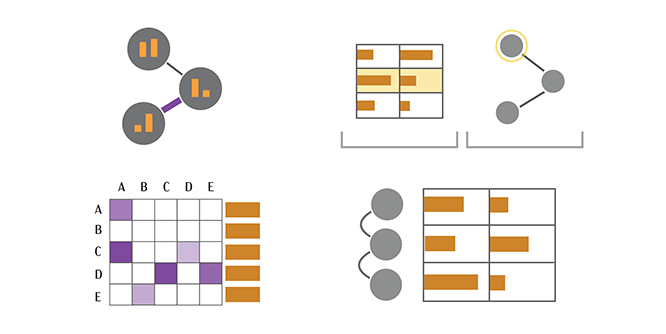
Evaluating Multivariate Network Visualization Techniques Using a Validated Design and Crowdsourcing Approach
SIGCHI Conference on Human Factors in Computing Systems (CHI), 2020
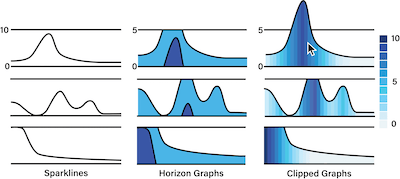
Clipped Graphs: A Compact Time-Series Encoding
Proceedings of the IEEE Information Visualization Conference – Posters (InfoVis), 2019
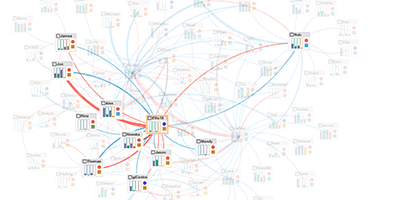
The State of the Art in Visualizing Multivariate Networks
Computer Graphics Forum (EuroVis), 2019
Origraph: Interactive Network Wrangling
IEEE Conference on Visual Analytics Science and Technology (VAST), 2019
VDL Project Staff


VDL Project Alumni
- Mark Dewy
- Jen Rogers
Other Staff
- Roni Choudhury (Kitware)
- Jake Conway (Kitware)