Multivariate Network Visualization Techniques

A companion website for the STAR Report on Multivariate Network Visualization Techniques.

Adjacency Matrix
Placeholder image

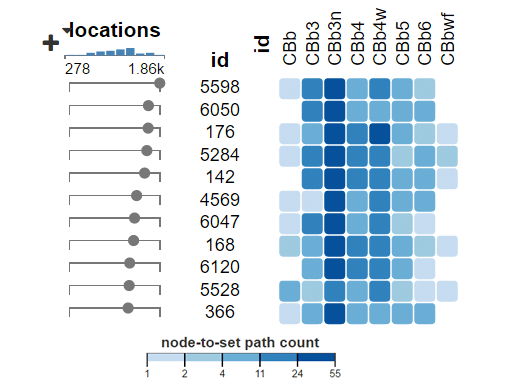
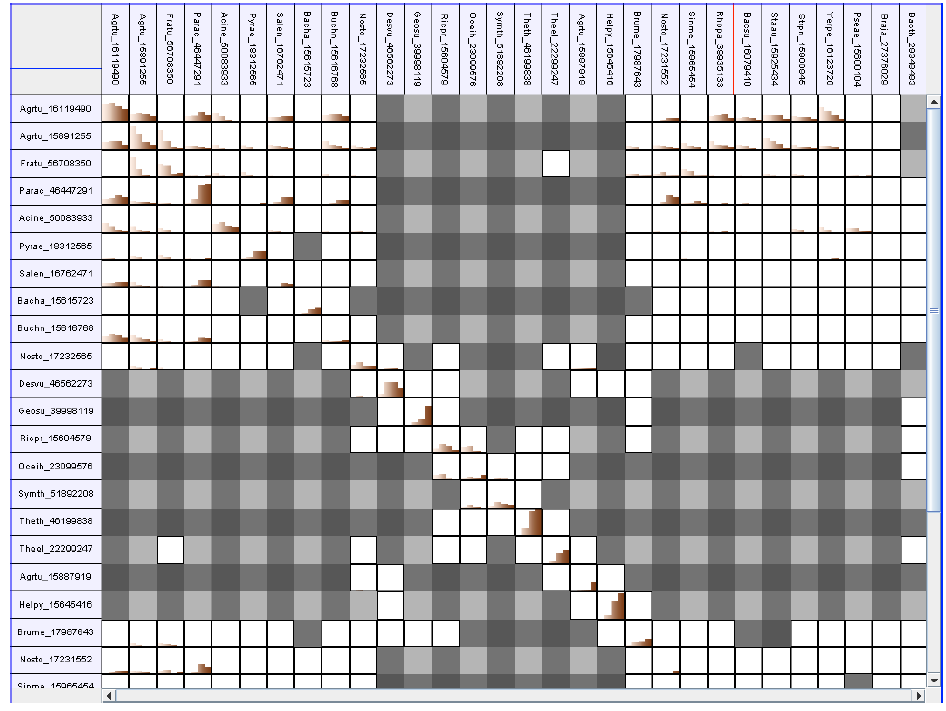
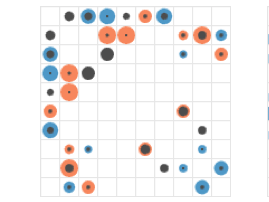
Adjacency matrices encode nodes as rows and columns, whereas the presence/absence of an edge between two nodes is encoded in the cell where the nodes rows and columns intersect.

Optimized for small and dense networks. Is well suited for several node attributes, preferably of homogenous types.

Supports several edge attributes, and heterogenous node or edge attributes. Can be used for layered or sparse networks.

Not ideal for tasks on paths and for visualizing trees.

Examples Figures from the Literature

Placeholder image
Kerzner et al. 2017
Placeholder image
Elmqvist et al. 2008
Placeholder image
Alper et al. 2013

Technique Scores

Reccommended Usage

Adjacency matrices are one of the most versatile approaches with regard to visualizing multiple attributes for nodes and edges. Alper et al. studied the efficacy of edge-attribute encodings by comparing edge-weight encodings on node-link diagrams to different edge-weight encodings in the cells of adjacency matrices. They conclude that in-cell encoding in adjacency matrices outperformed on-edge encoding on node-link diagrams for effectively displaying edge weights for their study subjects. Adjacency matrices require quadratic screen space with respect to the number of nodes; hence, the size of the network that can be visualized without aggregation is limited. Matrices reserve space for every possible edge, and, thus, dense and even completely connected networks are an ideal fit for matrices. Matrices are well suited for tasks involving all the topological structures we discuss, except for paths assuming an appropriate seriation method was applied. Overloaded approaches such as visually superimposing the paths directly on the adjacency matrix can aid in path-related tasks. Trees and layered networks can technically be visualized with an adjacency matrix, but the sparsity of these networks suggests that they are not a good fit. Overall, adjacency matrices are recommended for smaller, complex and dense networks with rich node and/or edge attributes, for all tasks except for those involving paths.

Example Papers

    Díaz J., Petit J., Serna M., A Survey of Graph Layout Problems. ACM Comput. Surv. (2002), vol. 34, no. 3, pp. 313–356, doi:10.1145/568522.568523.

    Díaz J., Petit J., Serna M., A Survey of Graph Layout Problems. ACM Comput. Surv. (2002), vol. 34, no. 3, pp. 313–356, doi:10.1145/568522.568523.

    Ghoniem M., Fekete J., Castagliola P., On the Readability of Graphs Using Node-Link and Matrix-Based Representations: A Controlled Experiment and Statistical Analysis. Information Visualization (2005), vol. 4, no. 2, pp. 114 -135, doi:10.1057/palgrave.ivs.9500092.

    Henry N., Fekete J., MatrixExplorer: a dual-representation system to explore social networks. IEEE Transactions on Visualization and Computer Graphics (2006), vol. 12, no. 5, pp. 677–684, .

    Shen Z., Maz K., Path Visualization for Adjacency Matrices. Proceedings of the 9th Joint Eurographics / IEEE VGTC Conference on Visualization (2007), pp. 83–90, doi:10.2312/VisSym/EuroVis07/083-090.

    Mueller C., Martin B., Lumsdaine A., A comparison of vertex ordering algorithms for large graph visualization. 2007 6th International Asia-Pacific Symposium on Visualization (2007), pp. 141-148, doi:10.1109/APVIS.2007.329289.

    Elmqvist N., Do T., Goodell H., Henry N., Fekete J., ZAME: Interactive Large-Scale Graph Visualization. Visualization Symposium, 2008. PacificVIS '08. IEEE Pacific (2008), pp. 215-222, doi:10.1109/PACIFICVIS.2008.4475479.

    Liiv I., Seriation and Matrix Reordering Methods: An Historical Overview. Statistical Analysis and Data Mining: The ASA Data Science Journal (2010), vol. 3, no. 2, pp. 70-91, doi:10.1002/sam.10071.

    Rufiange S., McGuffin M., Fuhrman C., TreeMatrix: A Hybrid Visualization of Compound Graphs. Computer Graphics Forum (2012), vol. 31, no. 1, pp. 89–101, doi:10.1111/j.1467-8659.2011.02087.x.

    Dunne C., Henry Riche N., Lee B., Metoyer R., Robertson G., GraphTrail: Analyzing Large Multivariate, Heterogeneous Networks While Supporting Exploration History. Proceedings of the ACM SIGCHI Conference on Human Factors in Computing Systems (CHI '12) (2012), pp. 1663–1672, doi:10.1145/2207676.2208293.

    Alper B., Bach B., Henry Riche N., Isenberg T., Fekete J., Weighted graph comparison techniques for brain connectivity analysis. Proceedings of the SIGCHI Conference on Human Factors in Computing Systems - CHI '13 (2013), pp. 483, doi:10.1145/2470654.2470724.

    Fekete J., Reorder.js: A JavaScript Library to Reorder Tables and Networks. IEEE Symposium on Information Visualization (2015), pp. 3, .

    Behrisch M., Bach B., Henry Riche N., Schreck T., Fekete J., Matrix Reordering Methods for Table and Network Visualization. Computer Graphics Forum (2016), vol. 35, no. 3, pp. 693-716, doi:10.1111/cgf.12935.

    Yang Y., Dwyer T., Goodwin S., Marriott K., Many-to-Many Geographically-Embedded Flow Visualisation: An Evaluation. IEEE Transactions on Visualization and Computer Graphics (2017), vol. 23, no. 1, pp. 411-420, doi:10.1109/TVCG.2016.2598885.

    Okoe M., Jianu R., Kobourov S., Revisited Network Representations. 25th Symposium on Graph Drawing (2017), pp. 16, .

    Kerzner E., Lex A., Sigulinsky C., Urness T., Jones B., Marc R., Meyer M., Graffinity: Visualizing Connectivity in Large Graphs. Computer Graphics Forum (2017), vol. 36, no. 3, pp. 251-260, doi:10.1111/cgf.13184.

    Okoe M., Jianu R., Kobourov S., Node-link or Adjacency Matrices: Old Question, New Insights. IEEE Transactions on Visualization and Computer Graphics (2018), pp. 1-1, doi:10.1109/TVCG.2018.2865940.