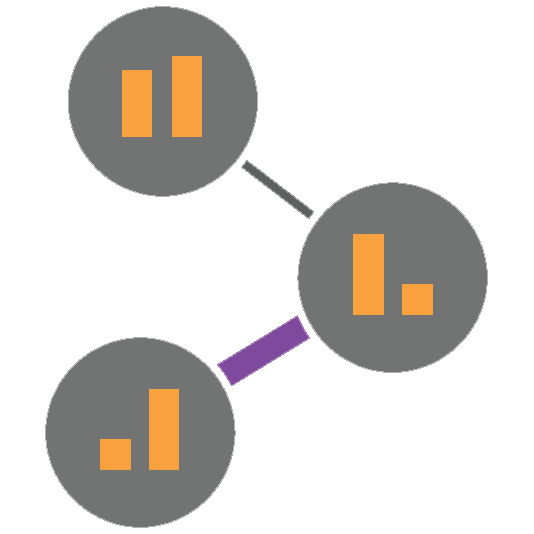
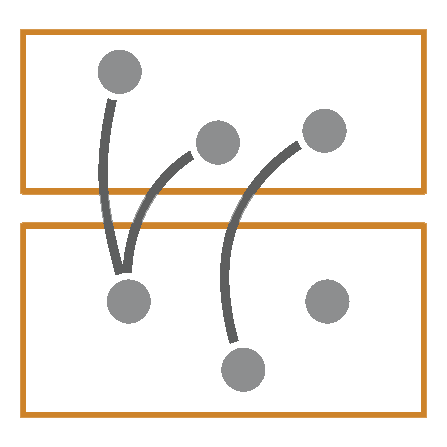
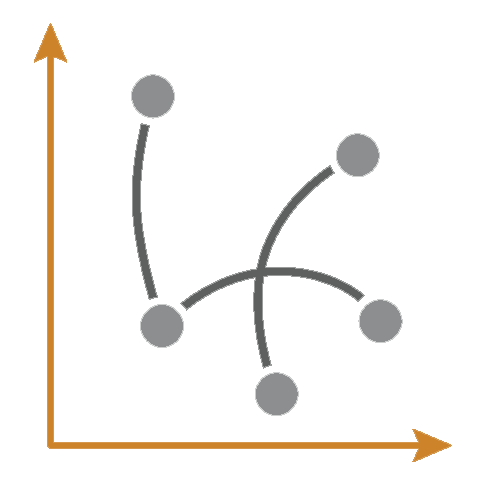
Node-link diagrams are the most common graphical representation of networks. In a node-link diagram, the nodes are drawn as point marks and the links as line/curve marks connecting the nodes. Node link layouts are the subject of their own field of study—graph drawing—and countless algorithms for node-link layouts have been developed [BETT98]. Schulz and Schumann [SS06] distinguish between free layouts, where the node layout is not restricted, an example of which is the force-directed placement; styled layouts, where the node positions are determined by a predefined scheme, such as a grid, or a radial layout; and fixed layouts where the position of the node is determined by an attribute, such as latitude and longitude on a map. In fixed layouts, the only degree of freedom is conferred to the drawing of the edges connecting the fixed nodes.
Multivariate Network Visualization Techniques
A companion website for the STAR Report on Multivariate Network Visualization Techniques.
Node Link Layouts
Tabular Layouts
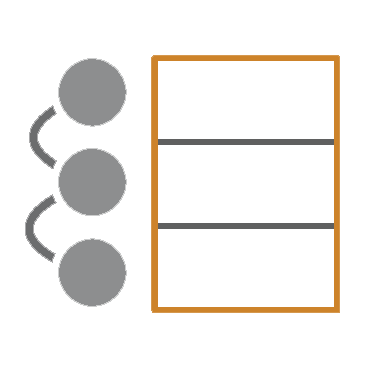
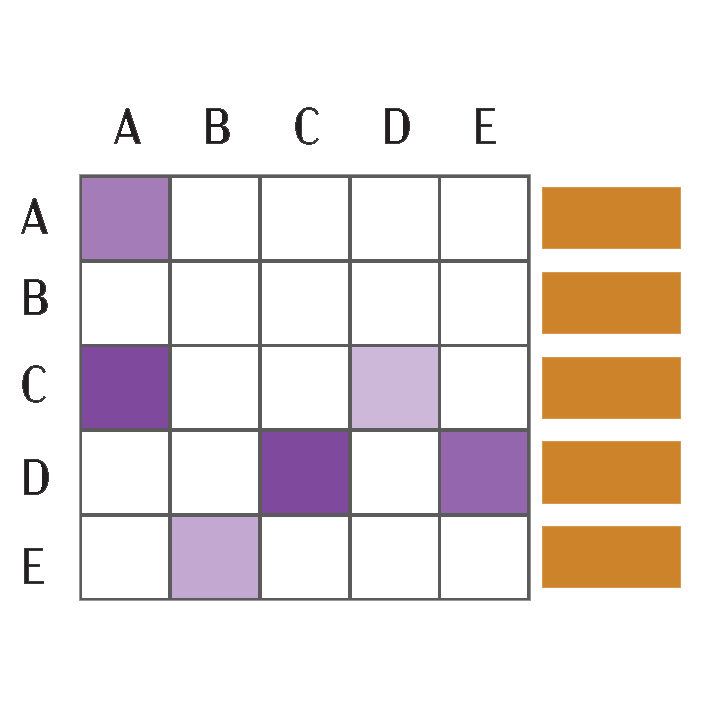
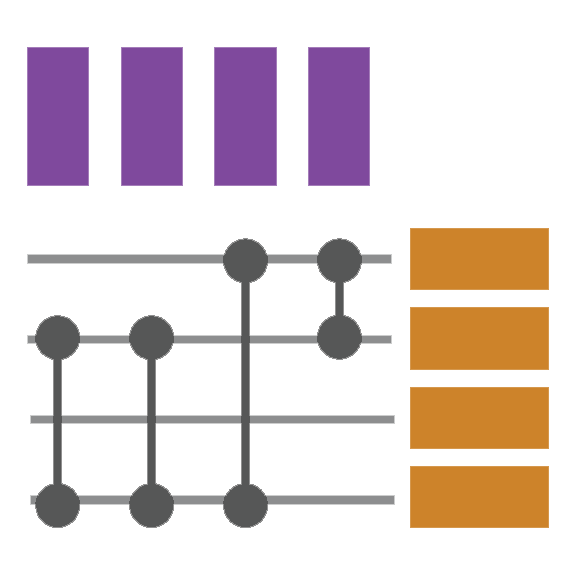
Tabular layouts encompass approaches where nodes and/or links are represented as columns and/or rows of a table. The most well known of these approaches is the adjacency matrix, but this category also includes Quilts and BioFabric. A beneficial property of all tabular layouts with respect to multivariate networks analysis is that nodes, and in some cases edges, are in dedicated rows or columns, which can also be used to visualize attributes.
Implicit Layouts
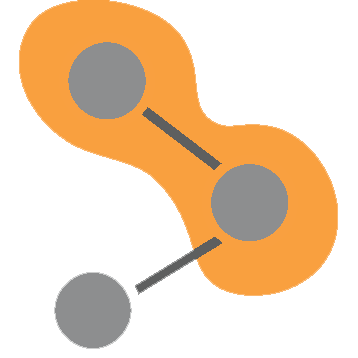
Implicit hierarchical layouts are techniques for visualizing trees that rely on node positioning to encode edges. Well-known examples are TreeMaps [JS91, vWvdW99], SunBursts [AH98, SZ00], or Icicle Plots [KL83], but many variations are possible [SHS11]. These layouts excel at visualizing a numerical node attribute as node size, and an additional node attribute as color, but are usually not amenable to encode multiple attributes simultaneously. Since edges are only implicitly encoded, edge attributes cannot be shown. We distinguish between two types of implicit hierarchical layouts: those that show the whole tree, i.e., the inner nodes and the leaves, and those that show only the leaves of the tree.


Coordinated Views
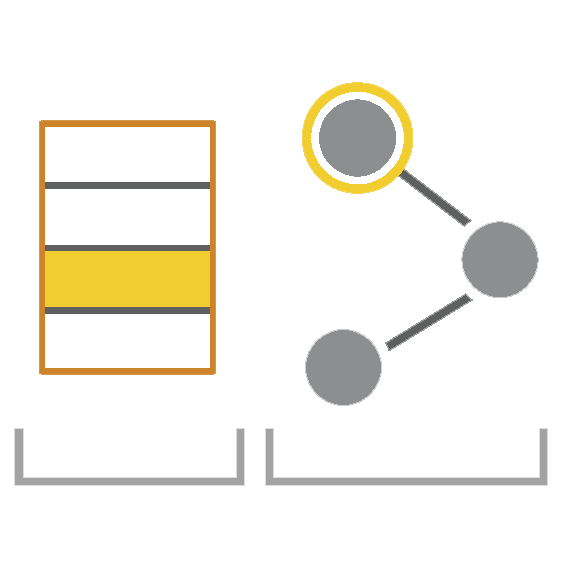
View operations combine existing techniques into coordinated views, a technique commonly referred to as Multiple Coordinated Views (MCVs). These approaches use separate, dedicated views for the attributes and the topology. Common examples are combinations of node-link diagrams with multidimensional data visualization techniques or providing a detail view for individual nodes.
