Multivariate Network Visualization Techniques

A companion website for the STAR Report on Multivariate Network Visualization Techniques.

Attribute Driven Positioning
Placeholder image

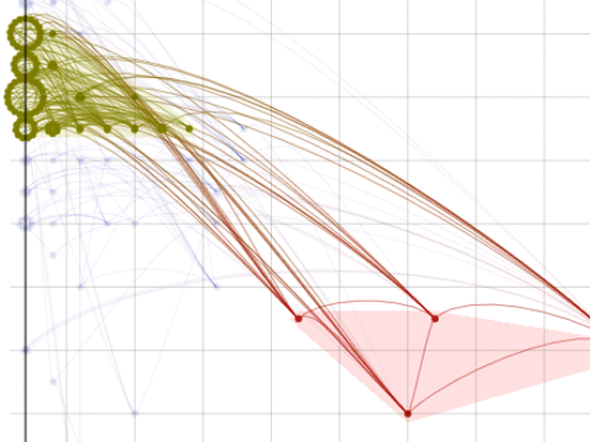
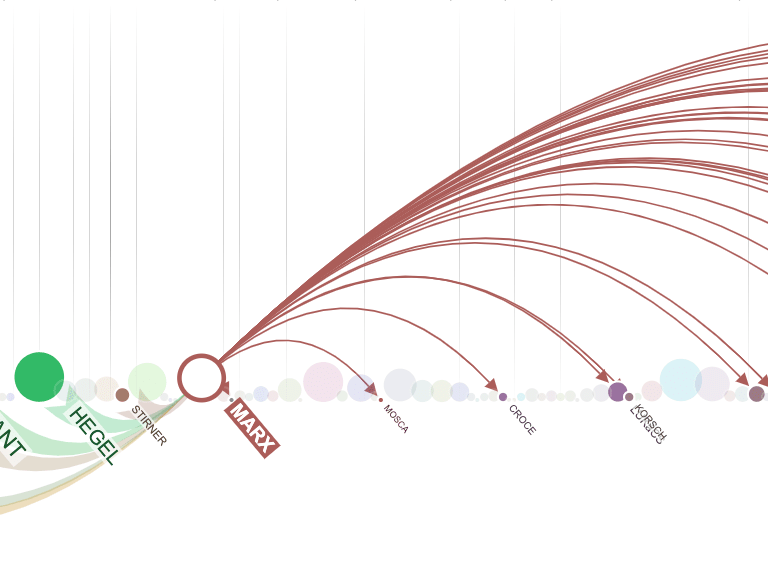
Attribute-driven positioning (fixed layouts) assigns node or edge positions according to one or more attribute values.

Optimized for small and sparse networks. Is well suited for few node attributes, particular of homogenous types.

Supports few edge attributes, but only if of homogenous types. Can be used for tasks on neighbors and networks.

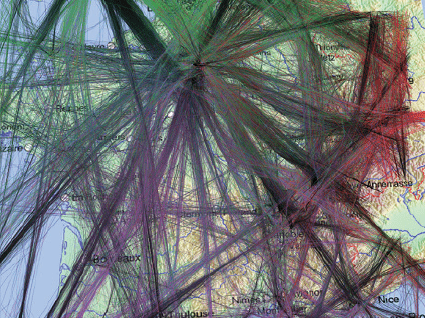
Not ideal for tasks on paths, clusters, and for large, dense, layered or tree networks.

Examples Figures from the Literature

Placeholder image
Bezerianos et al. 2010
Placeholder image
Dörk et al. 2011
Placeholder image
Peysakhovich et al. 2015

Technique Scores

Reccommended Usage

Attribute-driven positioning is well suited for cases where the value of a single node attribute or the relationships between two node attributes are the most important feature in a network dataset, but it does not lend itself well to visualizing the topology of the network. Even simple structures such as neighborhoods can be difficult to spot. Complex structures such as paths or clusters can be hidden completely. Unlike attribute-driven faceting, the technique is well suited for quantitative attributes. The technique works mostly for homogeneous networks since it relies on common node attributes for positioning. Due to the placement driven by attributes, nodes can occlude each other (although jitter was suggested to address that), and edge crossings are much more likely than, e.g., in a force-directed layout. Hence, attribute-driven positioning is not well suited for dense networks or for visualizing edge attributes. We recommend attribute-driven positioning for smaller, sparse networks where relationships between node attributes are paramount to the analysis task, and topological features only provide context.

Example Papers

    Bonabeau E., Graph multidimensional scaling with self-organizing maps. Information Sciences (2002), vol. 143, no. 1-4, pp. 159-180, doi:10.1016/S0020-0255(02)00191-3.

    Wattenberg M., Visual Exploration of Multivariate Graphs. Proceedings of the SIGCHI Conference on Human Factors in Computing Systems (2006), pp. 811–819, doi:10.1145/1124772.1124891.

    Holten D., Hierarchical Edge Bundles: Visualization of Adjacency Relations in Hierarchical Data. IEEE Transactions on Visualization and Computer Graphics (InfoVis '06) (2006), vol. 12, no. 5, pp. 741-748, doi:10.1109/TVCG.2006.147.

    Shneiderman B., Aris A., Network Visualization by Semantic Substrates. IEEE Transactions on Visualization and Computer Graphics (2006), vol. 12, no. 5, pp. 733-740, doi:10.1109/TVCG.2006.166.

    Holten D., Wijk J., Force-Directed Edge Bundling for Graph Visualization. Computer Graphics Forum (EuroVis '09) (2009), vol. 28, no. 3, pp. 983-990, doi:10.1111/j.1467-8659.2009.01450.x.

    Meyer M., Munzner T., Pfister H., MizBee: A Multiscale Synteny Browser. IEEE Transactions on Visualization and Computer Graphics (InfoVis '09) (2009), vol. 15, no. 6, pp. 897-904, doi:10.1109/TVCG.2009.167.

    Krzywinski M., Schein J., Birol I., Connors J., Gascoyne R., Horsman D., Jones S., Marra M., Circos: An information aesthetic for comparative genomics. Genome Research (2009), vol. 19, no. 9, pp. 1639-1645, doi:10.1101/gr.092759.109.

    Guo D., Flow Mapping and Multivariate Visualization of Large Spatial Interaction Data. IEEE Transactions on Visualization and Computer Graphics (2009), vol. 15, no. 6, pp. 1041-1048, doi:10.1109/TVCG.2009.143.

    Viau C., McGuffin M., Chiricota Y., Jurisica I., The FlowVizMenu and Parallel Scatterplot Matrix: Hybrid Multidimensional Visualizations for Network Exploration. IEEE Transactions on Visualization and Computer Graphics (InfoVis '10) (2010), vol. 16, no. 6, pp. 1100-1108, doi:10.1109/TVCG.2010.205.

    Bezerianos A., Chevalier F., Dragicevic P., Elmqvist N., Fekete J., GraphDice: A System for Exploring Multivariate Social Networks. Computer Graphics Forum (EuroVis '10) (2010), vol. 29, no. 3, pp. 863-872, doi:10.1111/j.1467-8659.2009.01687.x.

    Dörk M., Carpendale S., Williamson C., EdgeMaps: visualizing explicit and implicit relations. (2011), pp. 78680G, doi:10.1117/12.872578.

    Elzen S., Wijk J., Multivariate Network Exploration and Presentation: From Detail to Overview via Selections and Aggregations. IEEE Transactions on Visualization and Computer Graphics (InfoVis '14) (2014), vol. 20, no. 12, pp. 2310-2319, doi:10.1109/TVCG.2014.2346441.

    Peysakhovich V., Hurter C., Telea A., Attribute-driven edge bundling for general graphs with applications in trail analysis. 2015 IEEE Pacific Visualization Symposium (PacificVis) (2015), pp. 39-46, doi:10.1109/PACIFICVIS.2015.7156354.

    Lhuillier A., Hurter C., Telea A., State of the Art in Edge and Trail Bundling Techniques. Computer Graphics Forum (2017), vol. 36, no. 3, pp. 619-645, doi:10.1111/cgf.13213.

    Kruiger J., Rauber P., Martins R., Kerren A., Kobourov S., Telea A., Graph Layouts by t-SNE. Computer Graphics Forum (2017), vol. 36, no. 3, pp. 283-294, doi:10.1111/cgf.13187.