Multivariate Network Visualization Techniques

A companion website for the STAR Report on Multivariate Network Visualization Techniques.

BioFabric
Placeholder image

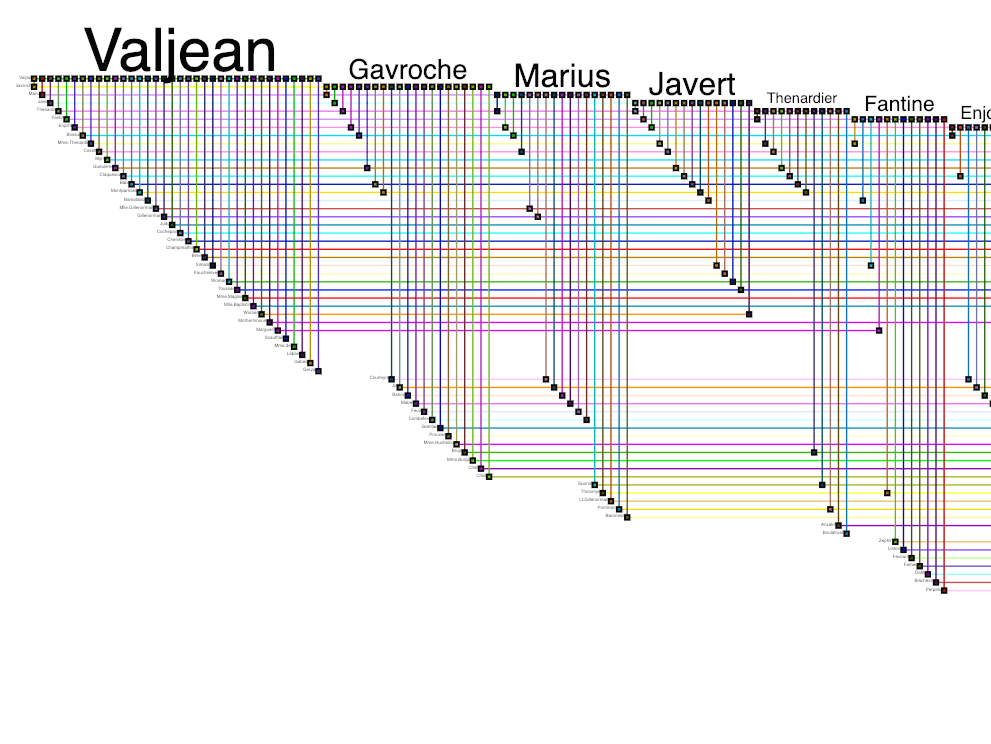
Biofabric is a tabular layout that places each node in a row of the table and draws edges between the nodes in columns.

Optimized for showing node and edge attributes since it supports several attributes and of heterogeneous types.

Supports tasks on subnetworks and layered networks.

Not ideal for tasks on neighbors, paths,clusters, or for graphs with over 100 nodes.

Examples Figures from the Literature

Placeholder image
Longabaugh , W. 2012

Technique Scores

Reccommended Usage

Biofabric is unique in that it can be used to visualize rich edge attributes and node attributes at the same time, while also making it possible to align these attribute visualizations on the same scale. It therefore has the potential to visualize large attribute datasets and also heterogeneous node types. Biofabric is about equally scalable to an adjacency matrix in terms of nodes, but less scalable with respect to the density of the network. Biofabric is not well studied with respect to users’ ability to detect topological features, but BioFabric is likely slightly more difficult for discovering neighbors and clusters than matrices. Overall, we recommend BioFabric for small, sparse networks with many nodes and rich edge attributes.

Example Papers

    Longabaugh W., Combing the hairball with BioFabric: a new approach for visualization of large networks. BMC Bioinformatics (2012), vol. 13, no. 1, pp. 275, doi:10.1186/1471-2105-13-275.