Multivariate Network Visualization Techniques

A companion website for the STAR Report on Multivariate Network Visualization Techniques.

Integrated
Placeholder image

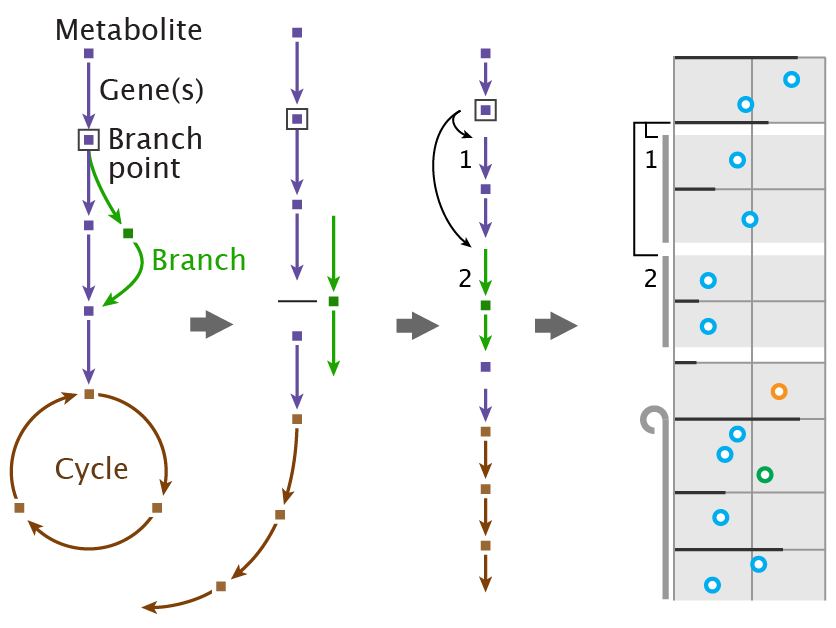
Unlike juxtaposed views, in integrated views the topology and the attribute visualizations are laid out with the other view in mind. Typically, integrated MCVs have an unambiguous spatial relationship between the topological features and their attributes.

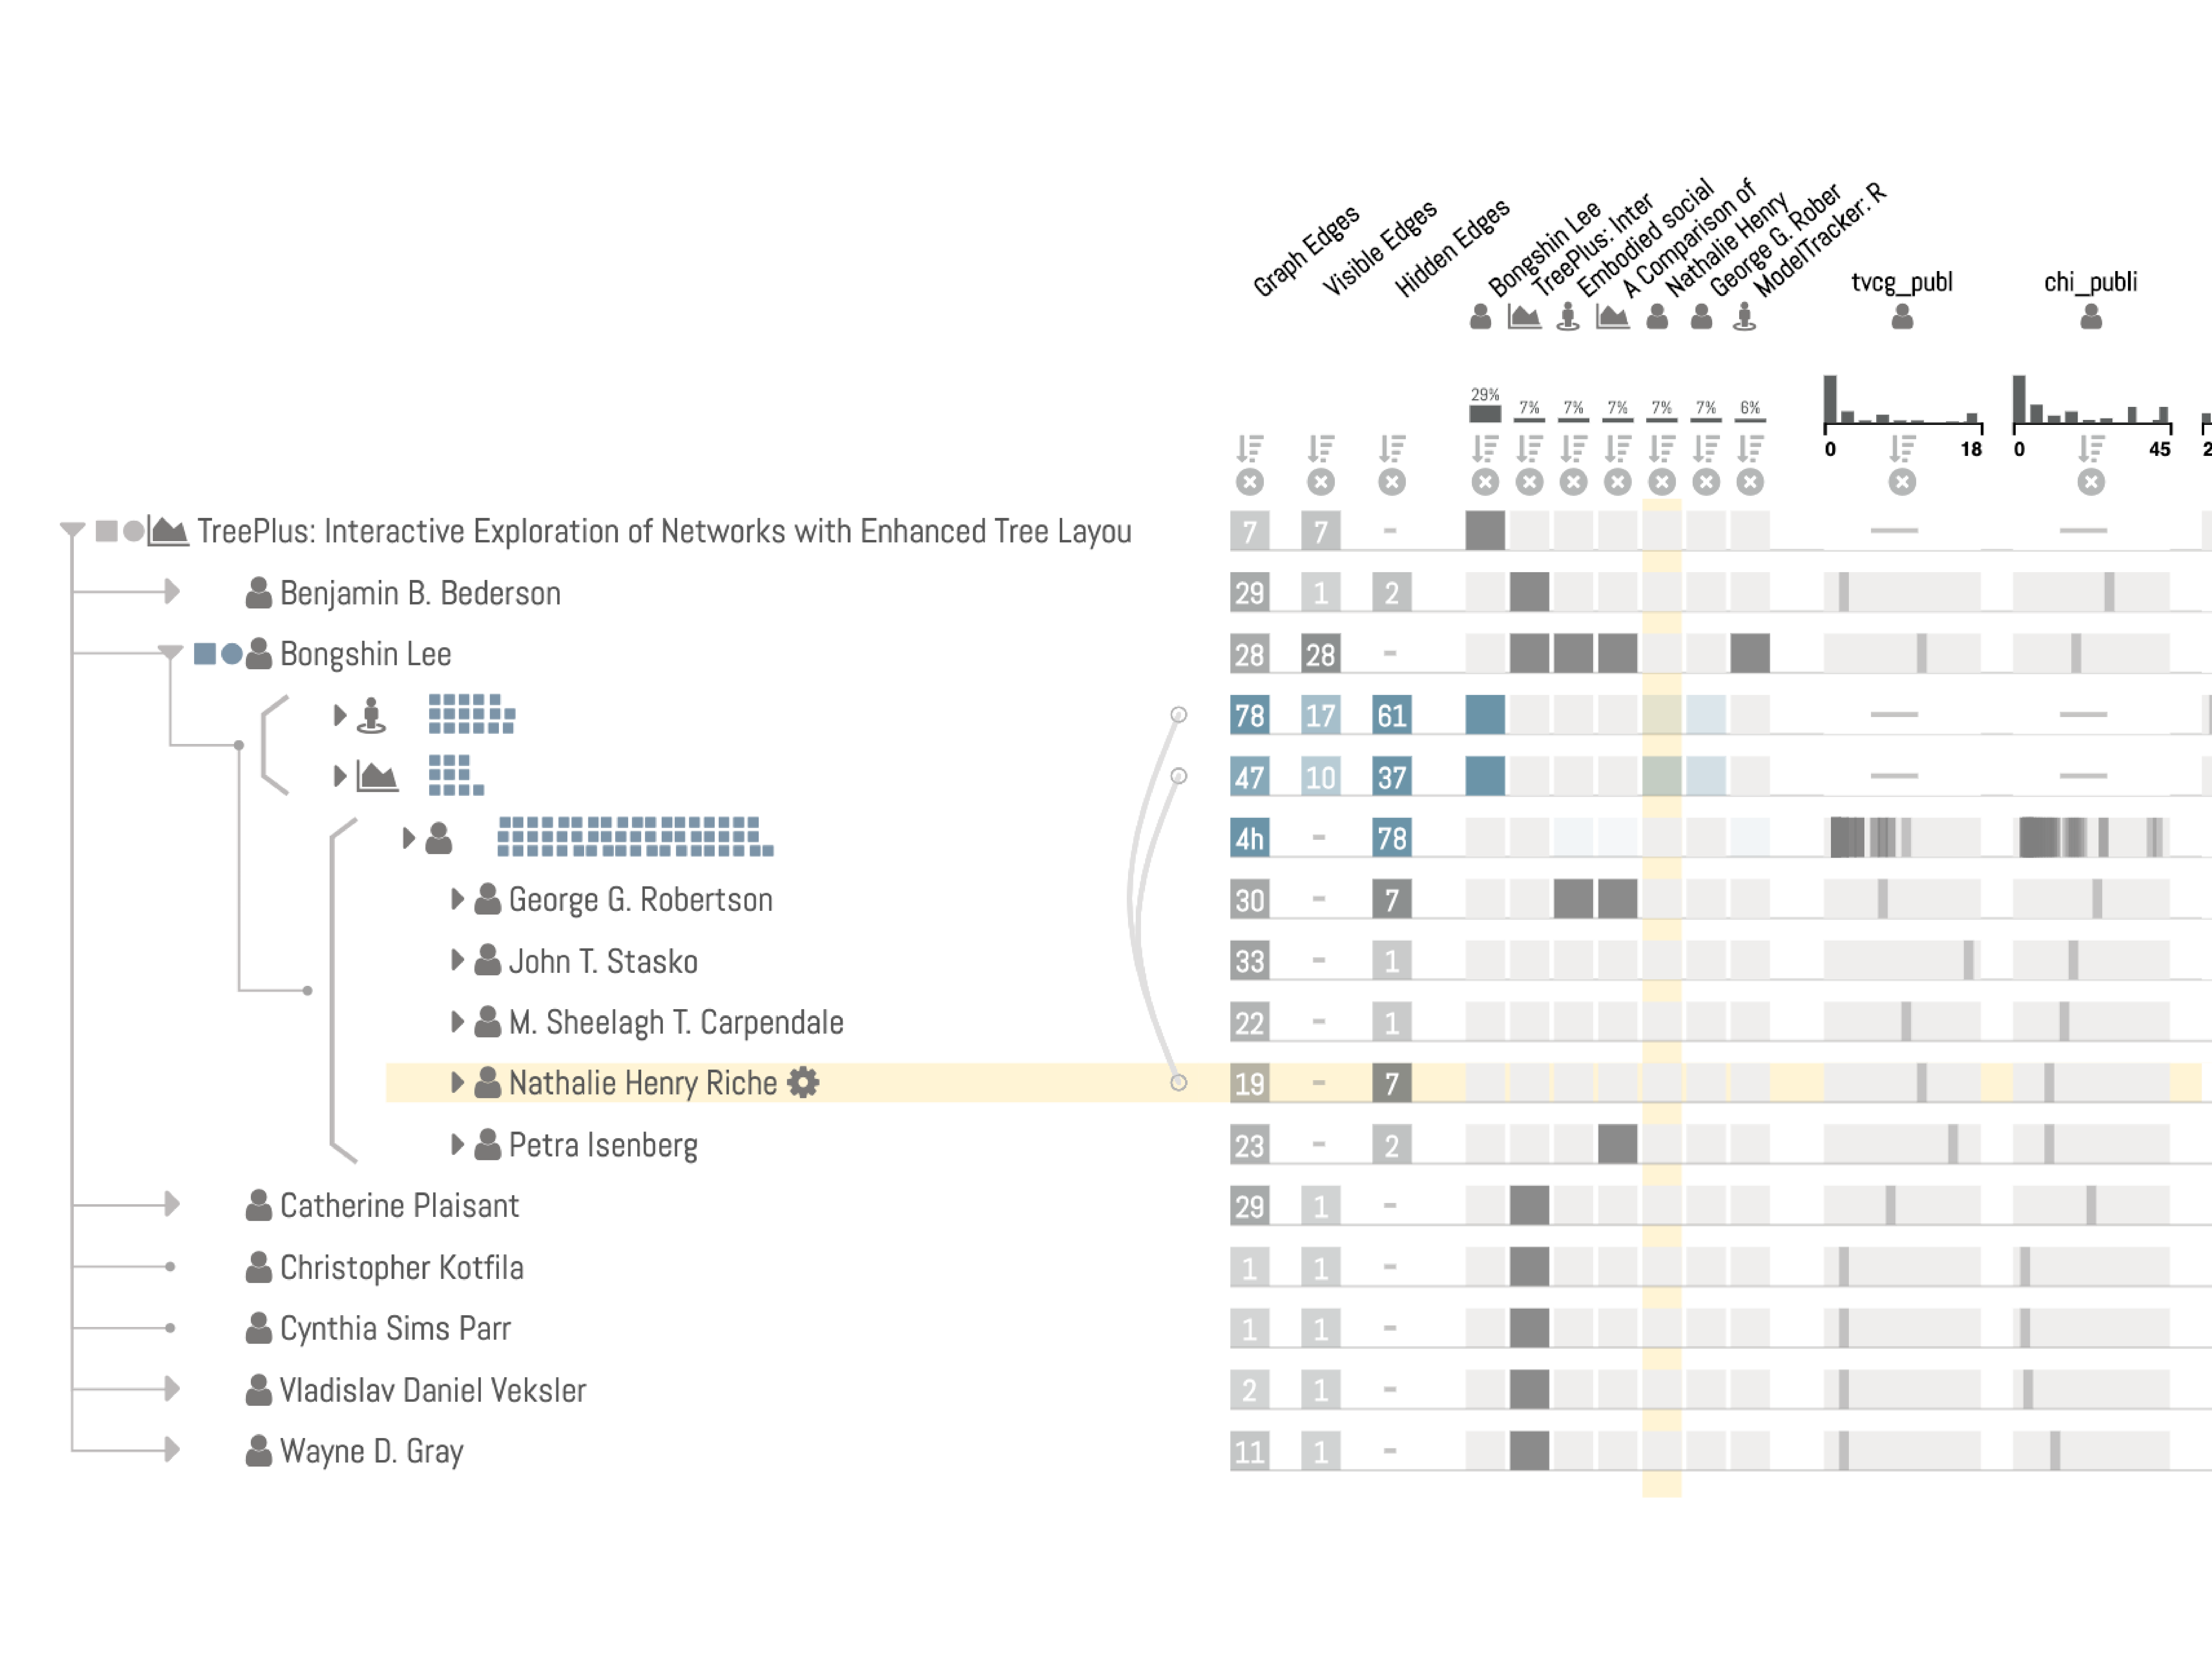
Optimized for networks with several, heterogenous, node attributes. Also ideal for tasks on single nodes, neighbors, and paths.

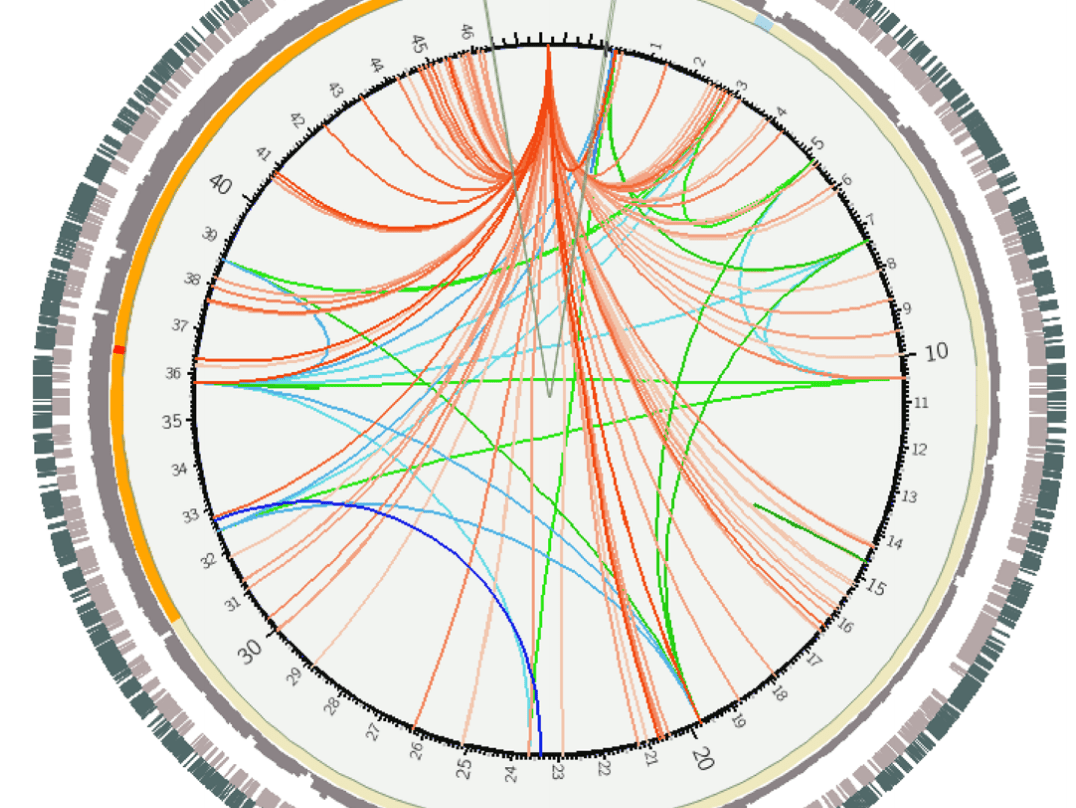
Supports edge attributes both homogeneous and heterogeneous, and tasks on subnetworks.

Not ideal for large networks, or tasks on clusters.

Examples Figures from the Literature

Placeholder image
Meyer et al. 2010
Placeholder image
Nobre et al. 2019
Placeholder image
Naquin et al. 2014

Technique Scores

Reccommended Usage

Integrated MCV approaches are exceptionally good at integrating complex attribute vectors of various types with topology, if the topology can be represented sensibly in a linear layout. Integration is easily achieved for tabular approaches such as adjacency matrices, trees, and cases where a linear ordering is natural, such as when using genome coordinates. For general networks, integrated MCVs can usually not visualize more complex topology, but they can be very useful if the network can be linearized, e.g., using spanning trees or user-selected paths. Compared to juxtaposed views, integrated views excel at tasks related to paths, neighborhoods, and when used with matrices, clusters (see Table 2). One drawback of integrated views is scalability with respect to the number of nodes and density.

Example Papers

    Eisen M., Spellman P., Brown P., Botstein D., Cluster analysis and display of genome-wide expression patterns. Proceedings of the National Academy of Sciences USA (1998), vol. 95, no. 25, pp. 14863-14868, doi:10.1073/pnas.95.25.14863.

    Seo J., Shneiderman B., Interactively Exploring Hierarchical Clustering Results. Computer (2002), vol. 35, no. 7, pp. 80-86, doi:10.1109/MC.2002.1016905.

    Lee B., Nachmanson L., Robertson G., Carlson J., Heckerman D., Det. (Distance Encoded Tree): A Scalable Visualization Tool for Mapping Multiple Traits to Large Evolutionary Trees. (2008), pp. 8, .

    Meyer M., Munzner T., Pfister H., MizBee: A Multiscale Synteny Browser. IEEE Transactions on Visualization and Computer Graphics (InfoVis '09) (2009), vol. 15, no. 6, pp. 897-904, doi:10.1109/TVCG.2009.167.

    Krzywinski M., Schein J., Birol I., Connors J., Gascoyne R., Horsman D., Jones S., Marra M., Circos: An information aesthetic for comparative genomics. Genome Research (2009), vol. 19, no. 9, pp. 1639-1645, doi:10.1101/gr.092759.109.

    Partl C., Lex A., Streit M., Kalkofen D., Kashofer K., Schmalstieg D., enRoute: Dynamic Path Extraction from Biological Pathway Maps for In-Depth Experimental Data Analysis. Proceedings of the IEEE Symposium on Biological Data Visualization (BioVis '12) (2012), pp. 107-114, doi:10.1109/BioVis.2012.6378600.

    Dunne C., Henry Riche N., Lee B., Metoyer R., Robertson G., GraphTrail: Analyzing Large Multivariate, Heterogeneous Networks While Supporting Exploration History. Proceedings of the ACM SIGCHI Conference on Human Factors in Computing Systems (CHI '12) (2012), pp. 1663–1672, doi:10.1145/2207676.2208293.

    Partl C., Lex A., Streit M., Kalkofen D., Kashofer K., Schmalstieg D., enRoute: Dynamic Path Extraction from Biological Pathway Maps for Exploring Heterogeneous Experimental Datasets. BMC Bioinformatics (2013), vol. 14, no. Suppl 19, pp. S3, doi:10.1186/1471-2105-14-S19-S3.

    Naquin D., d’Aubenton-Carafa Y., Thermes C., Silvain M., CIRCUS: a package for Circos display of structural genome variations from paired-end and mate-pair sequencing data. BMC Bioinformatics (2014), vol. 15, no. 1, doi:10.1186/1471-2105-15-198.

    Partl C., Gratzl S., Streit M., Wassermann A., Pfister H., Schmalstieg D., Lex A., Pathfinder: Visual Analysis of Paths in Graphs. Computer Graphics Forum (EuroVis '16) (2016), vol. 35, no. 3, pp. 71-80, doi:10.1111/cgf.12883.

    Nobre C., Streit M., Lex A., Juniper: A Tree+Table Approach to Multivariate Graph Visualization. Transaction on Visualization and Computer Graphics (InfoVis '18) (2019), vol. 25, no. 1, doi:10.1109/TVCG.2018.2865149.

    Nobre C., Gehlenborg N., Coon H., Lex A., Lineage: Visualizing Multivariate Clinical Data in Genealogy Graphs. Transaction on Visualization and Computer Graphics (2019), vol. 25, no. 3, pp. 1543 - 1558, doi:10.1109/TVCG.2018.2811488.