Multivariate Network Visualization Techniques

A companion website for the STAR Report on Multivariate Network Visualization Techniques.

Overloaded
Placeholder image

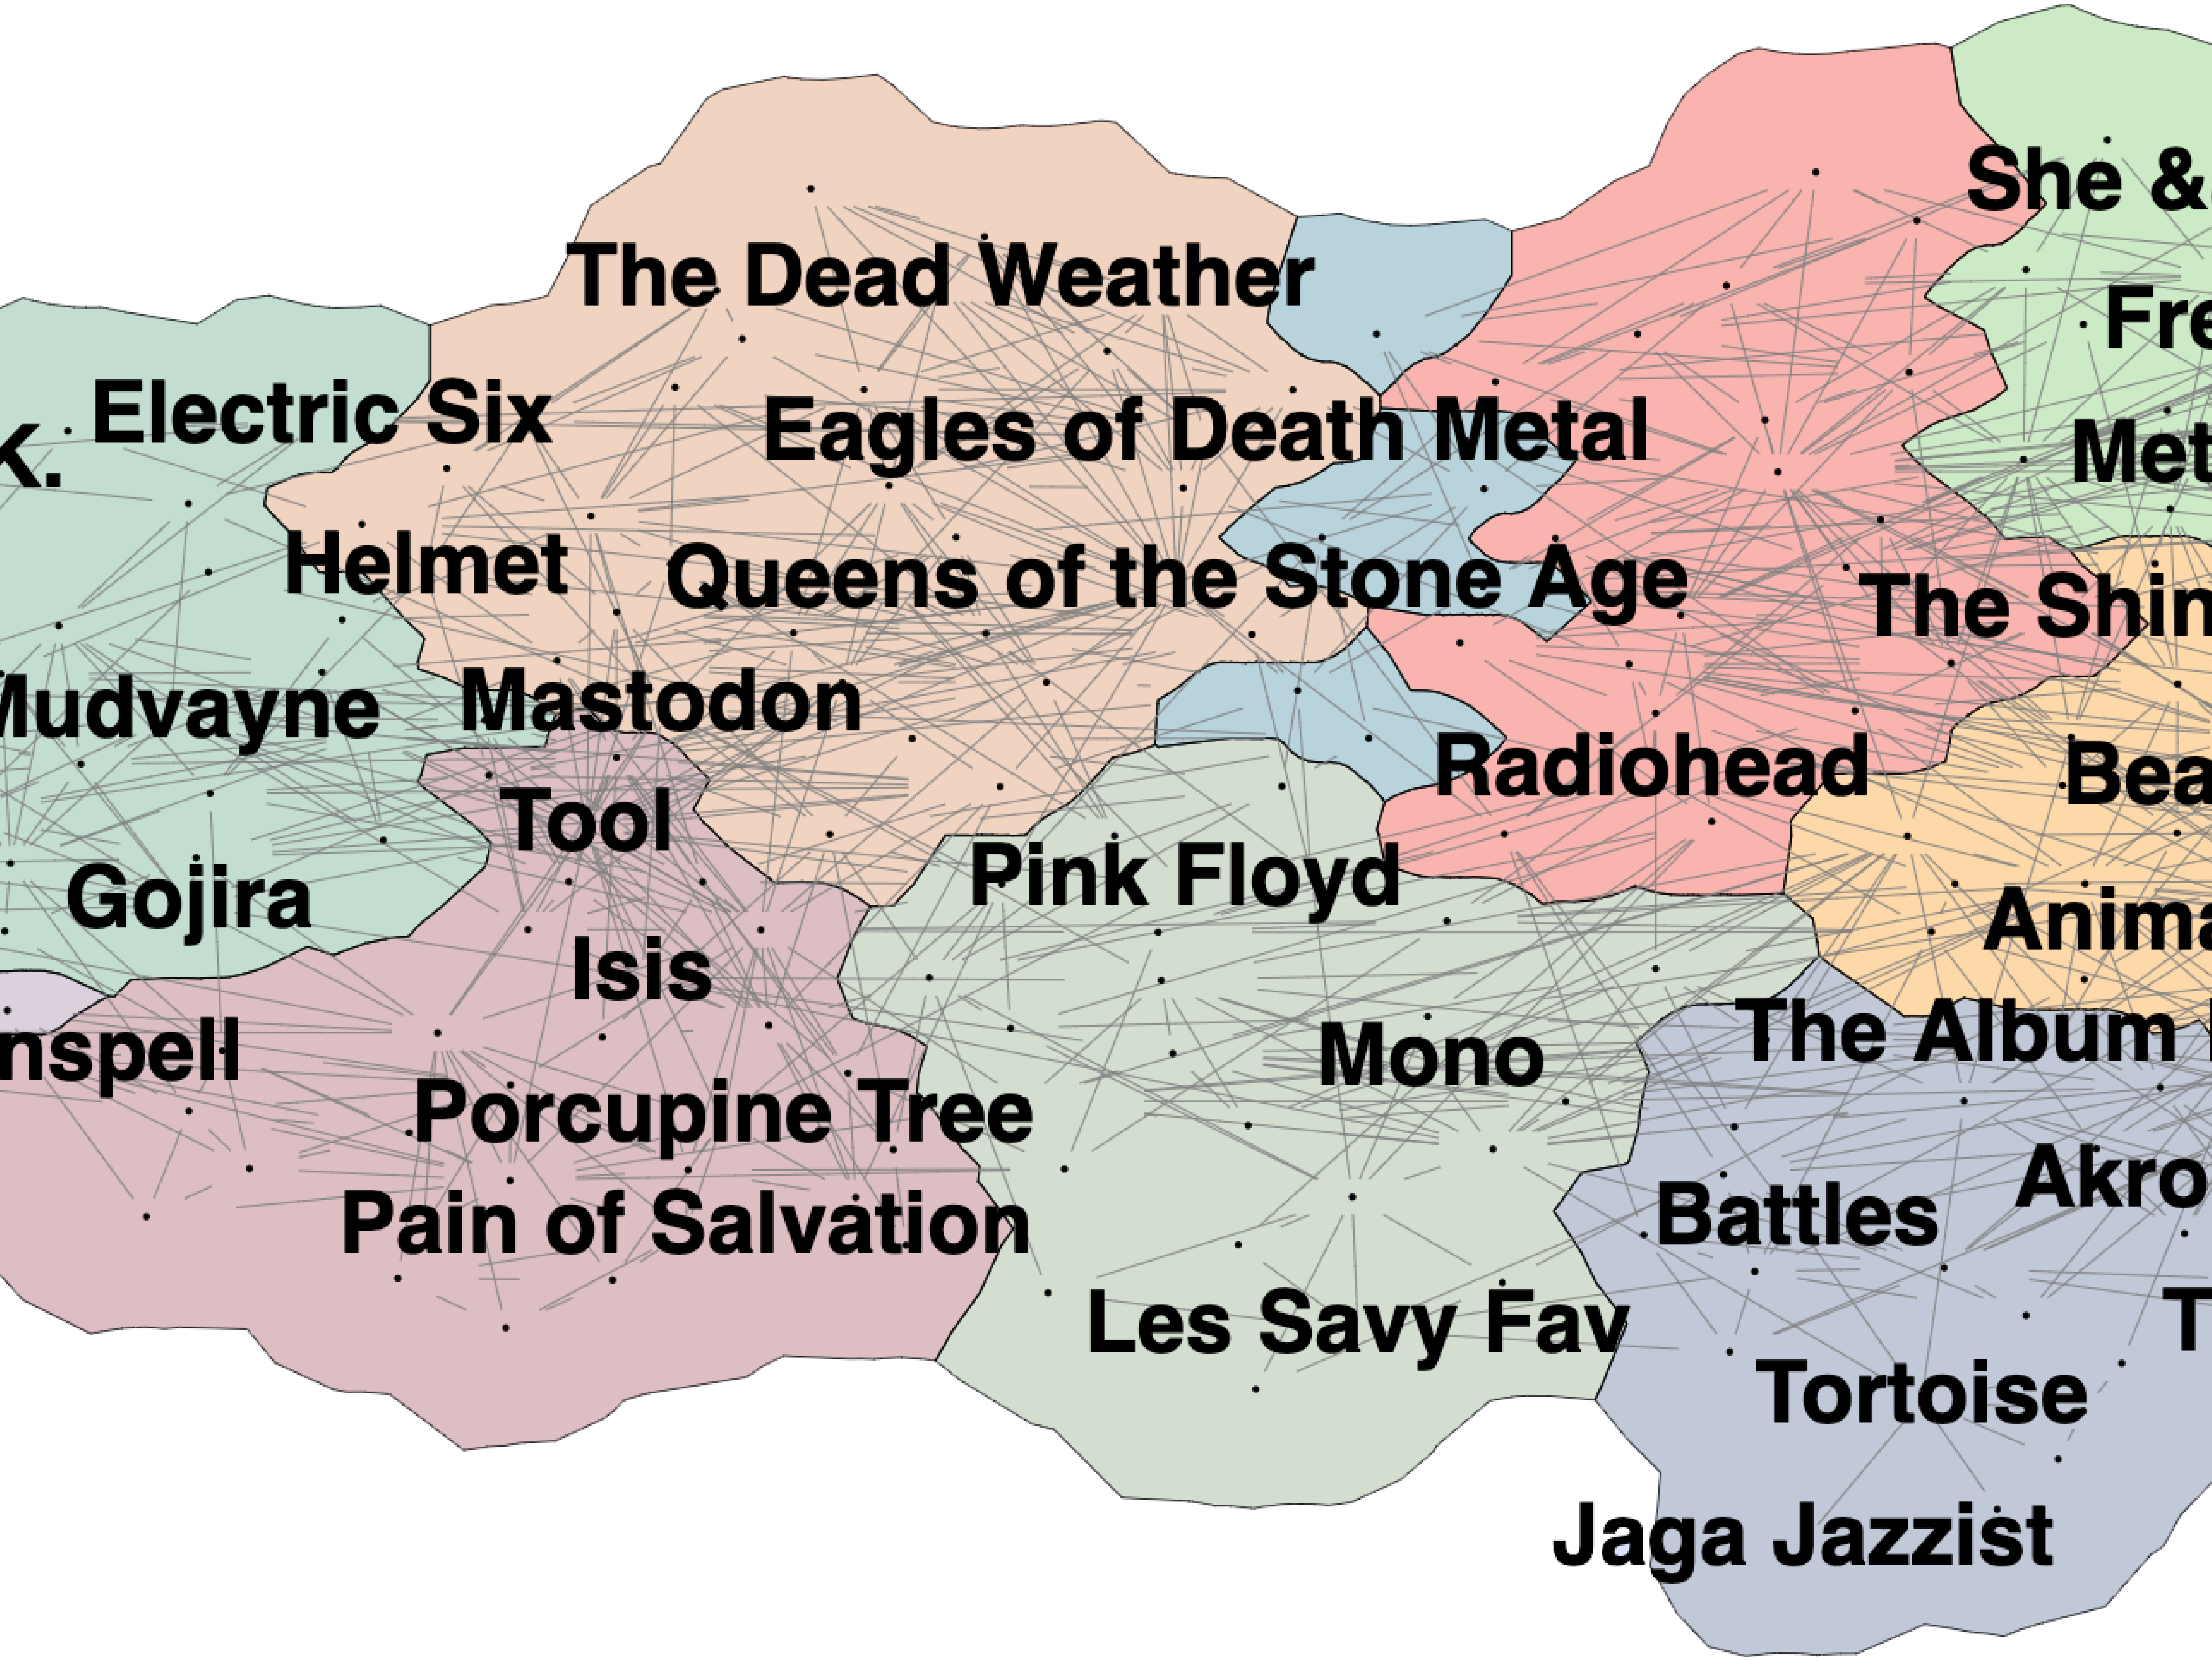
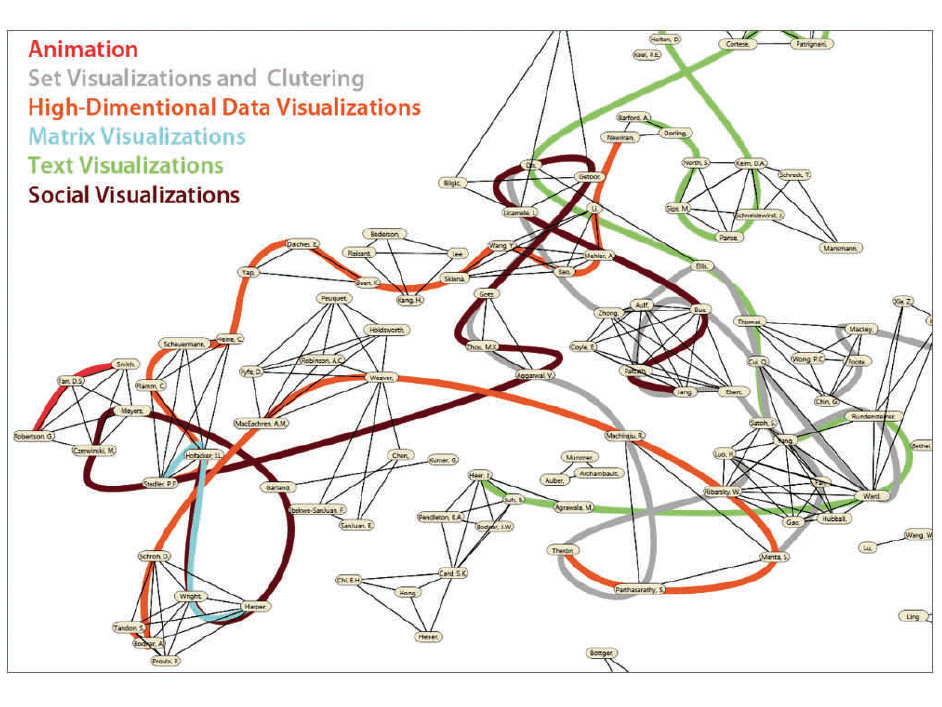
Overloaded views are those that display two encodings on top of each other. We distinguish overloading from on-node encoding in that it encodes shared properties of nodes by overlaying a visual feature on the whole view.

Optimized for networks with few, homogeneous, node attributes. Also ideal for layered networks, trees, and tasks on single nodes, neighbors, and clusters.

Supports tasks on clusters and subnetworks.

Not ideal for encoding edge attributes of any type, as well as severl heterogeneous node attributes.

Examples Figures from the Literature

Placeholder image
Gansner et al. 2010
Placeholder image
Alper et al. 2011

Technique Scores

Reccommended Usage

Overloaded views are well suited for display sets, groupings, or clusters on top of an existing representation of the topology of the network. Overloading works best if the grouped elements are also in spatial proximity in the underlying topology representation, which is commonly the case when visualizing cluster membership. The major limitation of this approach is the limited number of concurrent attributes it supports. While encoding one or two attributes simultaneously is possible, encoding more than two attributes with overloading can lead to clutter. We hence recommend overloading for the particular use case of visualizing set-memberships or clusters on top of node-link diagrams.

Example Papers

    Heer J., Boyd D., Vizster: visualizing online social networks. IEEE Symposium on Information Visualization, 2005. INFOVIS 2005 (2005), pp. 32-39, doi:10.1109/INFVIS.2005.1532126.

    Collins C., Penn G., Carpendale S., Bubble Sets: Revealing Set Relations with Isocontours over Existing Visualizations. IEEE Transactions on Visualization and Computer Graphics (InfoVis '09) (2009), vol. 15, no. 6, pp. 1009-1016, doi:10.1109/TVCG.2009.122.

    Bezerianos A., Chevalier F., Dragicevic P., Elmqvist N., Fekete J., GraphDice: A System for Exploring Multivariate Social Networks. Computer Graphics Forum (EuroVis '10) (2010), vol. 29, no. 3, pp. 863-872, doi:10.1111/j.1467-8659.2009.01687.x.

    Gansner E., Hu Y., Kobourov S., GMap: Visualizing graphs and clusters as maps. 2010 IEEE Pacific Visualization Symposium (PacificVis) (2010), pp. 201-208, doi:10.1109/PACIFICVIS.2010.5429590.

    Alper B., Riche N., Ramos G., Czerwinski M., Design Study of LineSets, a Novel Set Visualization Technique. IEEE Transactions on Visualization and Computer Graphics (InfoVis '11) (2011), vol. 17, no. 12, pp. 2259-2267, doi:10.1109/TVCG.2011.186.

    Saket B., Simonetto P., Kobourov S., Group-Level Graph Visualization Taxonomy. arXiv:1403.7421 [cs] (2014), .