Multivariate Network Visualization Techniques

A companion website for the STAR Report on Multivariate Network Visualization Techniques.

Faceting
Placeholder image

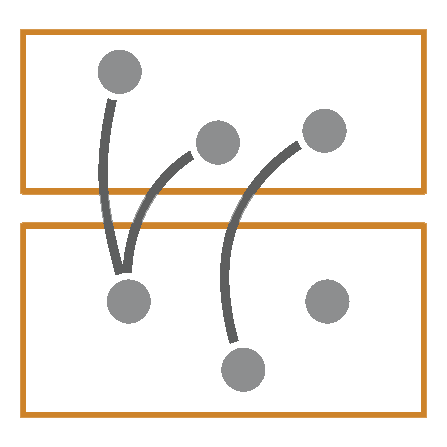
Attribute-driven faceting groups nodes according to one or more attributes and places the elements of a group in a shared region.

Optimized for networks with few, but homogeneous or heteregenous node attributes. Also ideal for layered sparse or layered graphs.

Supports few, homogenous edge attributes, and tasks on neighbors.

Not ideal for dense, layered or tree networks. Also, ill suited for tasks on paths or clusters.
Examples Figures from the Literature

Placeholder image
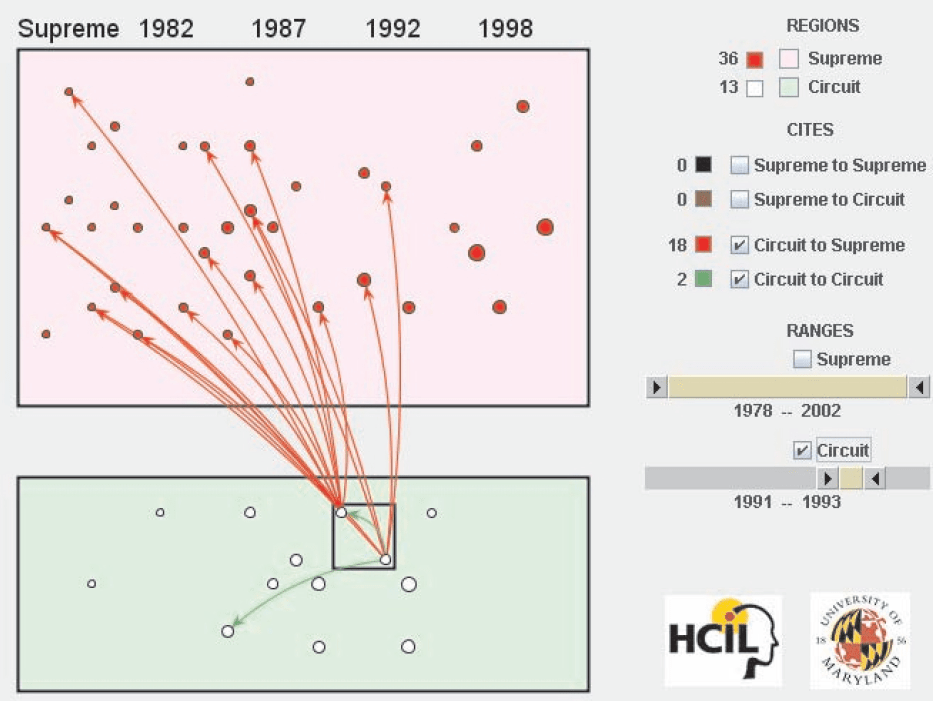
Shneiderman et al. 2006
Placeholder image
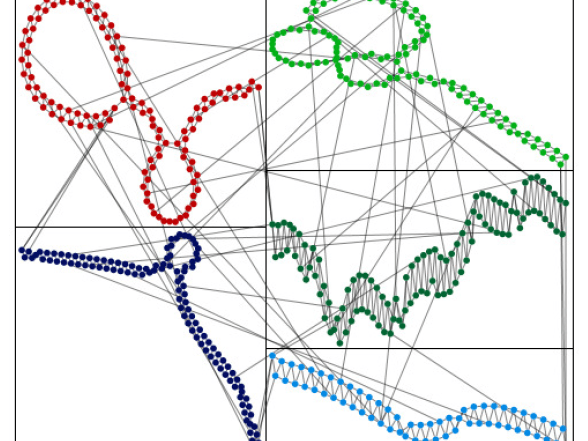
Rodrigues et al. 2011

Technique Scores

Reccommended Usage

Attribute-driven faceting is well suited for networks with different node types or with an important categorical or set-like attribute. Such faceting is especially useful when the separation into groups and the study of the interaction within and between the groups are the subject of the analysis, which is commonly the case in k-partite and layered networks (see Table 2). Due to restrictions on the layout, it is slightly less scalable with respect to the number of nodes and network density than node-link layouts. Other attributes can be visualized independently of the basic principle of faceting, so that the scalability with respect to other attributes depends on these choices. Edge attributes are not supported by faceting and have to rely on a secondary encoding. Neighborhoods, paths, and clusters are not easily visible if they span different facets.We recommend attribute faceting for cases where nodes can be separated into groups easily and where these groups are central to the analysis.

Example Papers

    Shneiderman B., Aris A., Network Visualization by Semantic Substrates. IEEE Transactions on Visualization and Computer Graphics (2006), vol. 12, no. 5, pp. 733-740, doi:10.1109/TVCG.2006.166.

    Ahmed A., Batagelj V., Fu X., Hong S., Merrick D., Mrvar A., Visualisation and analysis of the internet movie database. 2007 6th International Asia-Pacific Symposium on Visualization (2007), pp. 17-24, doi:10.1109/APVIS.2007.329304.

    Aris A., Shneiderman B., Designing Semantic Substrates for Visual Network Exploration. Information Visualization (2007), vol. 6, no. 4, pp. 281-300, doi:10.1057/palgrave.ivs.9500162.

    Barsky A., Munzner T., Gardy J., Kincaid R., Cerebral: Visualizing Multiple Experimental Conditions on a Graph with Biological Context. IEEE Transactions on Visualization and Computer Graphics (InfoVis '08) (2008), vol. 14, no. 6, pp. 1253-1260, doi:10.1109/TVCG.2008.117.

    Schulz H., John M., Unger A., Schumann H., Visual Analysis of Bipartite Biological Networks. Proceedings of the Eurographics Workshop on Visual Computing for Biomedicine (VCBM '08) (2008), pp. 135-142, doi:10.2312/VCBM/VCBM08/135-142.

    Pretorius A., Wijk J., Visual Inspection of Multivariate Graphs. Computer Graphics Forum (EuroVis '08) (2008), vol. 27, no. 3, pp. 967-974, doi:10.1111/j.1467-8659.2008.01231.x.

    Rodrigues E., Milic-Frayling N., Smith M., Shneiderman B., Hansen D., Group-in-a-Box Layout for Multi-faceted Analysis of Communities. 2011 IEEE Third Int'l Conference on Privacy, Security, Risk and Trust and 2011 IEEE Third Int'l Conference on Social Computing (2011), pp. 354-361, doi:10.1109/PASSAT/SocialCom.2011.139.

    Ghani S., Kwon B., Lee S., Yi J., Elmqvist N., Visual Analytics for Multimodal Social Network Analysis: A Design Study with Social Scientists. IEEE Transactions on Visualization and Computer Graphics (VAST '13) (2013), vol. 19, no. 12, pp. 2032-2041, doi:10.1109/TVCG.2013.223.

    Partl C., Lex A., Streit M., Strobelt H., Wassermann A., Pfister H., Schmalstieg D., ConTour: Data-Driven Exploration of Multi-Relational Datasets for Drug Discovery. IEEE Transactions on Visualization and Computer Graphics (VAST '14) (2014), vol. 20, no. 12, pp. 1883-1892, doi:10.1109/TVCG.2014.2346752.