Multivariate Network Visualization Techniques

A companion website for the STAR Report on Multivariate Network Visualization Techniques.

Juxtaposed
Placeholder image

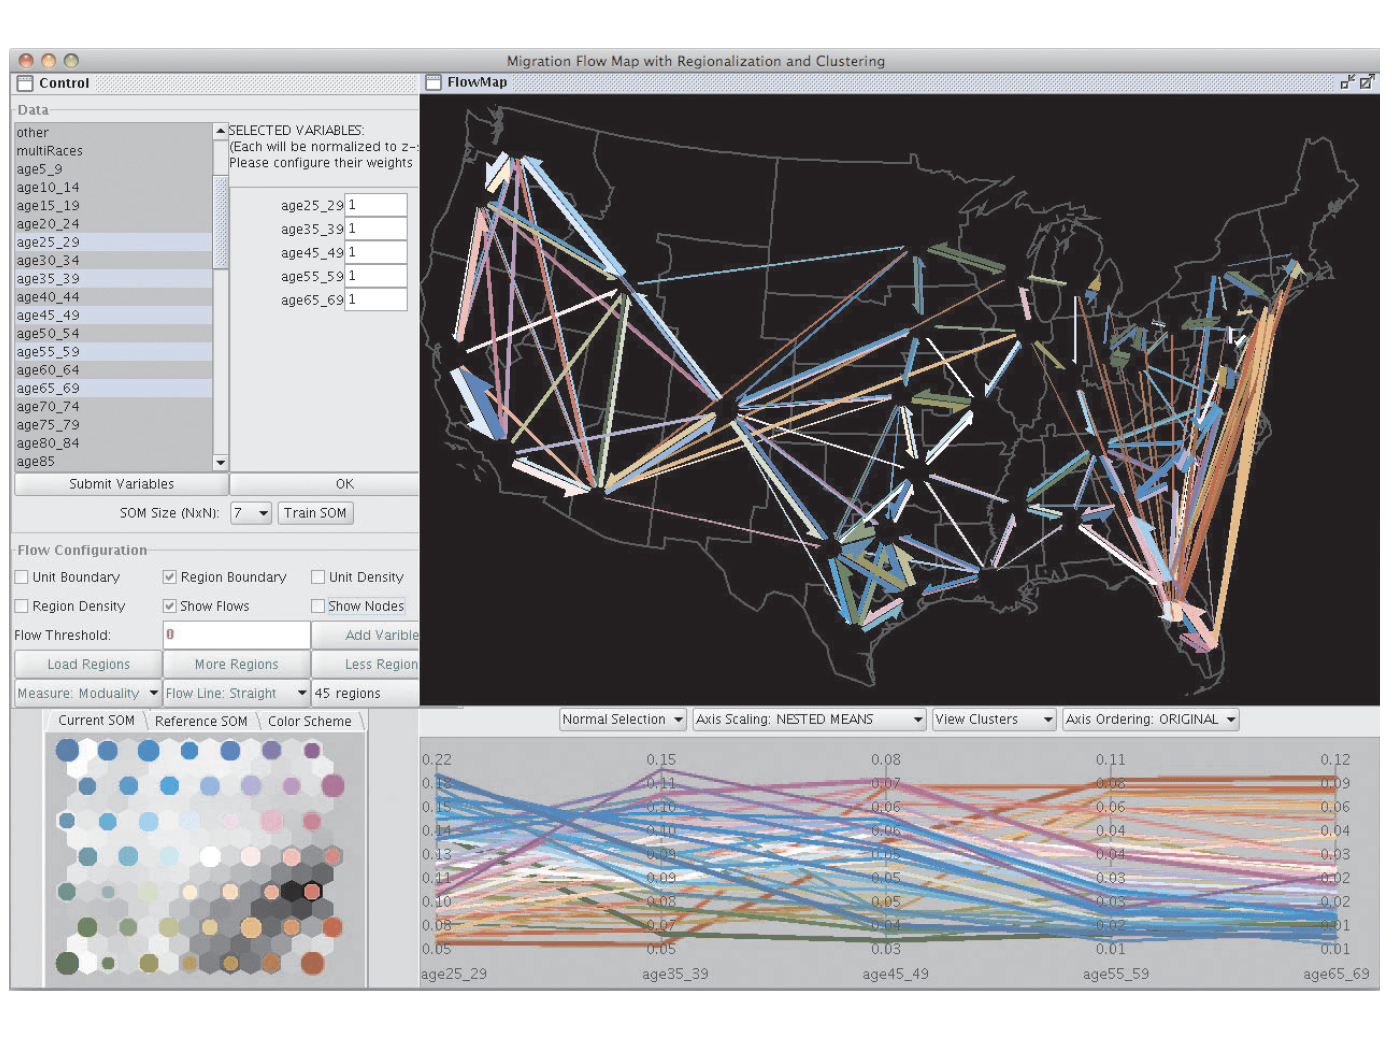
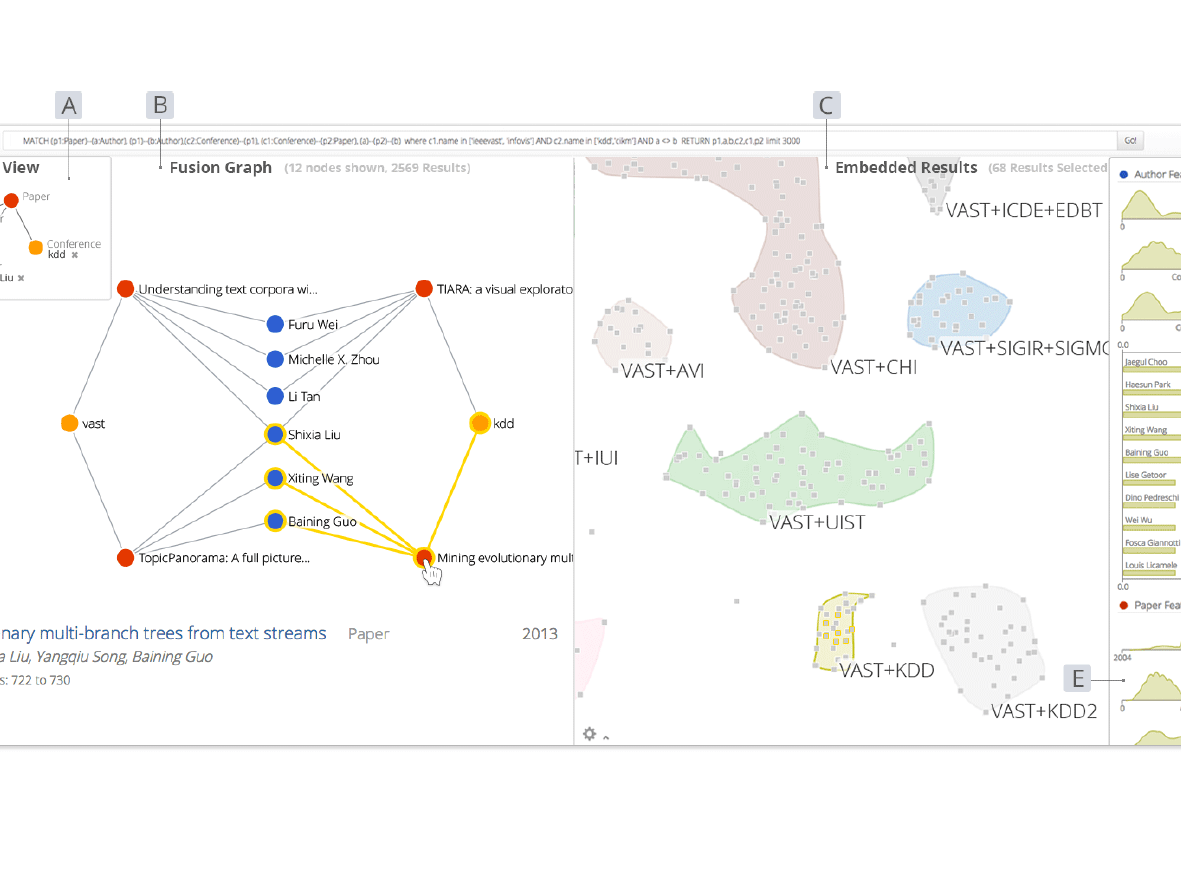
In the context of MCV visualization, juxtaposed views separate the topology visualization from the attribute visualization into two or more views. Links between the topology and the attributes are not encoded and typically are revealed through interaction by linking and brushing.

Optimized for networks with several, heterogenous, node or attributes. Also ideal for layered networks and trees.

Supports medium networks, as well as tasks on clusters and subnetworks.

Not ideal for large or dense networks, as well as tasks on neighbors and paths.

Examples Figures from the Literature

Placeholder image
Guo , D. 2009
Placeholder image
Pienta et al. 2018

Technique Scores

Reccommended Usage

Juxtaposed MCVs are recommended for large networks and/or very large numbers or heterogeneous types of node and link attributes. Since each view can optimize for either topology or attributes without concern for the other, the independent analysis of attributes or topology is generally well supported. Linking and brushing can reintroduce the connection, but require interaction, and even then matches between specific items in a large brushed set are difficult to identify. Consequently, juxtaposed views do not support the tasks on our topological structures well.

Example Papers

    Plaisant C., Shneiderman B., Mushlin R., An information architecture to support the visualization of personal histories. Information Processing & Management (1998), vol. 34, no. 5, pp. 581-597, doi:10.1016/S0306-4573(98)00024-7.

    Abello J., Ham F., Matrix Zoom: A Visual Interface to Semi-External Graphs. IEEE Symposium on Information Visualization (2004), pp. 183-190, doi:10.1109/INFVIS.2004.46.

    Heer J., Boyd D., Vizster: visualizing online social networks. IEEE Symposium on Information Visualization, 2005. INFOVIS 2005 (2005), pp. 32-39, doi:10.1109/INFVIS.2005.1532126.

    Stasko J., Görg C., Liu Z., Jigsaw: Supporting Investigative Analysis through Interactive Visualization. Information Visualization (2008), vol. 7, no. 2, pp. 118–132, doi:10.1057/palgrave.ivs.9500180.

    Guo D., Flow Mapping and Multivariate Visualization of Large Spatial Interaction Data. IEEE Transactions on Visualization and Computer Graphics (2009), vol. 15, no. 6, pp. 1041-1048, doi:10.1109/TVCG.2009.143.

    Viau C., McGuffin M., Chiricota Y., Jurisica I., The FlowVizMenu and Parallel Scatterplot Matrix: Hybrid Multidimensional Visualizations for Network Exploration. IEEE Transactions on Visualization and Computer Graphics (InfoVis '10) (2010), vol. 16, no. 6, pp. 1100-1108, doi:10.1109/TVCG.2010.205.

    Bezerianos A., Chevalier F., Dragicevic P., Elmqvist N., Fekete J., GraphDice: A System for Exploring Multivariate Social Networks. Computer Graphics Forum (EuroVis '10) (2010), vol. 29, no. 3, pp. 863-872, doi:10.1111/j.1467-8659.2009.01687.x.

    Ko S., Afzal S., Walton S., Yang Y., Chae J., Malik A., Jang Y., Chen M., Ebert D., Analyzing high-dimensional multivaríate network links with integrated anomaly detection, highlighting and exploration. 2014 IEEE Conference on Visual Analytics Science and Technology (VAST) (2014), pp. 83-92, doi:10.1109/VAST.2014.7042484.

    Pienta R., Hohman F., Endert A., Tamersoy A., Roundy K., Gates C., Navathe S., Chau D., VIGOR: Interactive Visual Exploration of Graph Query Results. IEEE Transactions on Visualization and Computer Graphics (2018), vol. 24, no. 1, pp. 215-225, doi:10.1109/TVCG.2017.2744898.