Multivariate Network Visualization Techniques

A companion website for the STAR Report on Multivariate Network Visualization Techniques.

On-Node/On-Edge Encoding
Placeholder image

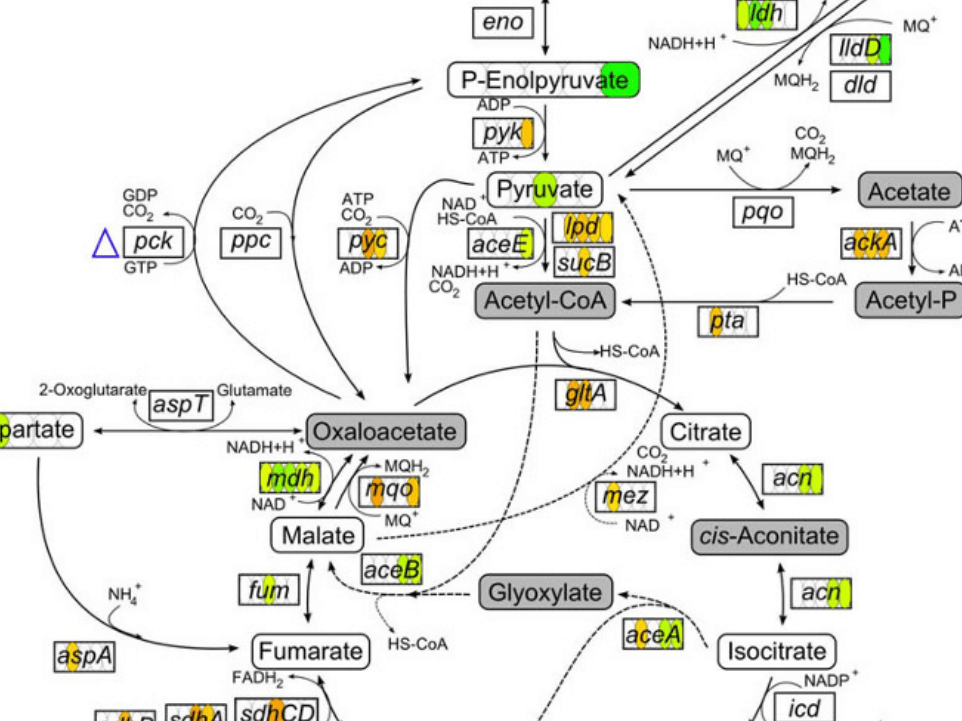
On-node and on-edge encoding refers to modifying the visual appearance (size, color) of a node or an edge or embedding marks (bar charts, line charts, etc.) in a node or an edge in a node-link diagram.

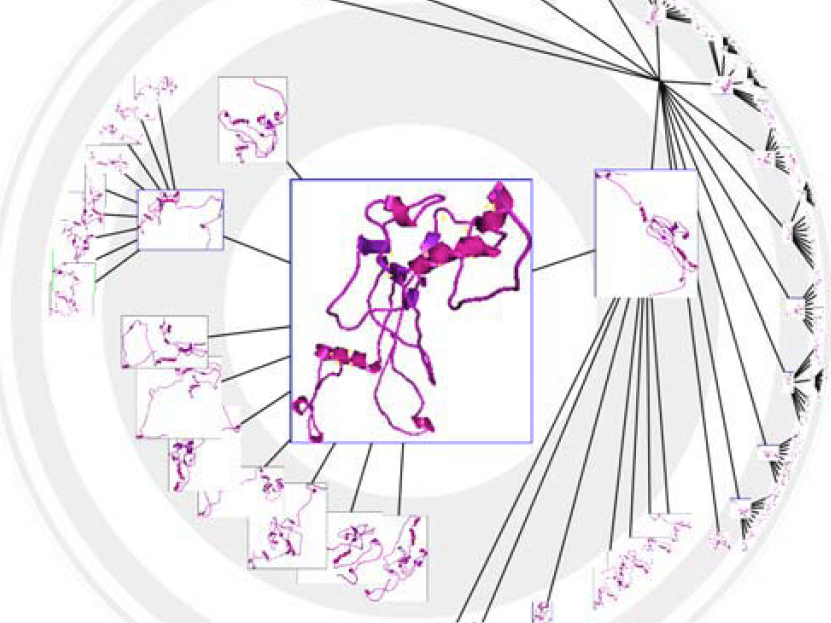
Optimized for layered networks and trees. Also ideal for tasks on single nodes or immediate neighbors.

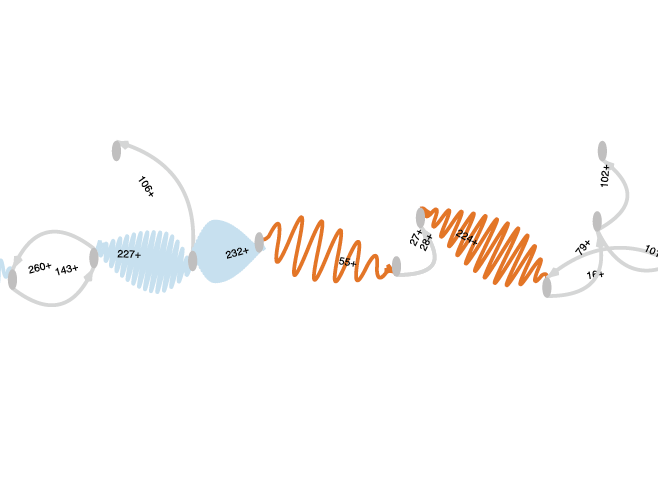
Supports tasks on paths, clusters, and subnetworks.

Not ideal for large or dense networks, as well as encoding several or heterogeneous edge attributes.

Examples Figures from the Literature

Placeholder image
Neuweger et al. 2009
Placeholder image
Jankun-Kelly et al. 2003
Placeholder image
Nielsen et al. 2009

Technique Scores

Reccommended Usage

On-node/edge encoding supports the integration of topology and attribute-based tasks well, and supports all kinds of MVN tasks on all structures. On-node/edge encoding is easily understood by most users, and works well for sparse complex networks, layered networks, and trees. However, it comes with scalability trade-offs. Even for a modest number of nodes in a node-link layout, node size has to be limited; hence little space is available to encode attributes. When details about nodes are shown, as for example in MoireGraphs , the number of nodes that can be displayed simultaneously is limited. We recommend on-node layouts when only a few (usually under 5) attributes on the nodes are shown. On-node encoding generally works well for networks with different node types. On-edge encoding is even more limited than on-node encoding. First, most node-link layouts guarantee that nodes do not overlap; however edges commonly cross even in fairly sparse networks, interfering with on-edge encoding. Second, the nature of the link mark as a slim line limits the discriminability of any modulation of the visual channel. We recommend on-edge encoding for a single numerical or categorical attribute only.

Example Papers

    Jankun-Kelly T., Ma K., MoireGraphs: radial focus+context visualization and interaction for graphs with visual nodes. IEEE Symposium on Information Visualization 2003 (IEEE Cat. No.03TH8714) (2003), pp. 59-66, doi:10.1109/INFVIS.2003.1249009.

    Auber D., Chiricota Y., Jourdan F., Melancon G., Multiscale visualization of small world networks. IEEE Symposium on Information Visualization 2003 (IEEE Cat. No.03TH8714) (2003), pp. 75-81, doi:10.1109/INFVIS.2003.1249011.

    Heer J., Boyd D., Vizster: visualizing online social networks. IEEE Symposium on Information Visualization, 2005. INFOVIS 2005 (2005), pp. 32-39, doi:10.1109/INFVIS.2005.1532126.

    Junker B., Klukas C., Schreiber F., VANTED: A system for advanced data analysis and visualization in the context of biological networks. BMC Bioinformatics (2006), vol. 7, no. 1, pp. 109, doi:10.1186/1471-2105-7-109.

    Westenberg M., Hijum S., Kuipers O., Roerdink J., Visualizing Genome Expression and Regulatory Network Dynamics in Genomic and Metabolic Context. Computer Graphics Forum (2008), vol. 27, no. 3, pp. 887-894, doi:10.1111/j.1467-8659.2008.01221.x.

    Guo D., Flow Mapping and Multivariate Visualization of Large Spatial Interaction Data. IEEE Transactions on Visualization and Computer Graphics (2009), vol. 15, no. 6, pp. 1041-1048, doi:10.1109/TVCG.2009.143.

    Nielsen C., Jackman S., Birol I., Jones S., ABySS-Explorer: visualizing genome sequence assemblies. IEEE transactions on visualization and computer graphics (2009), vol. 15, no. 6, pp. 881-888, doi:10.1109/TVCG.2009.116.

    Neuweger H., Persicke M., Albaum S., Bekel T., Dondrup M., Hüser A., Winnebald J., Schneider J., Kalinowski J., Goesmann A., Visualizing post genomics data-sets on customized pathway maps by ProMeTra – aeration-dependent gene expression and metabolism of Corynebacterium glutamicum as an example. BMC Systems Biology (2009), vol. 3, no. 1, pp. 82, doi:10.1186/1752-0509-3-82.

    Gehlenborg N., O'Donoghue S., Baliga N., Goesmann A., Hibbs M., Kitano H., Kohlbacher O., Neuweger H., Schneider R., Tenenbaum D., Gavin A., Visualization of omics data for systems biology. Nature Methods (2010), vol. 7, no. 3, pp. 56-68, doi:10.1038/nmeth.1436.

    Jusufi I., Dingjie Y., Kerren A., The Network Lens: Interactive Exploration of Multivariate Networks Using Visual Filtering. Proceedings of the Conference on Information Visualisation (2010), pp. 35-42, doi:10.1109/IV.2010.15.

    Holten D., Isenberg P., Wijk J., Fekete J., An extended evaluation of the readability of tapered, animated, and textured directed-edge representations in node-link graphs. 2011 IEEE Pacific Visualization Symposium (PacificVis) (2011), pp. 195-202, doi:10.1109/PACIFICVIS.2011.5742390.

    Ghani S., Elmqvist N., Improving revisitation in graphs through static spatial features. Proceedings of Graphics Interface 2011 (2011), pp. 175--182, .

    Xu K., Rooney C., Passmore P., Ham D., Nguyen P., A User Study on Curved Edges in Graph Visualization. IEEE Transactions on Visualization and Computer Graphics (2012), vol. 18, no. 12, pp. 2449-2456, doi:10.1109/TVCG.2012.189.

    Dunne C., Shneiderman B., Motif simplification: improving network visualization readability with fan, connector, and clique glyphs. Proceedings of the SIGCHI Conference on Human Factors in Computing Systems - CHI '13 (2013), pp. 3247, doi:10.1145/2470654.2466444.

    Elzen S., Wijk J., Multivariate Network Exploration and Presentation: From Detail to Overview via Selections and Aggregations. IEEE Transactions on Visualization and Computer Graphics (InfoVis '14) (2014), vol. 20, no. 12, pp. 2310-2319, doi:10.1109/TVCG.2014.2346441.

    Ko S., Afzal S., Walton S., Yang Y., Chae J., Malik A., Jang Y., Chen M., Ebert D., Analyzing high-dimensional multivaríate network links with integrated anomaly detection, highlighting and exploration. 2014 IEEE Conference on Visual Analytics Science and Technology (VAST) (2014), pp. 83-92, doi:10.1109/VAST.2014.7042484.

    Schöffel S., Schwank J., Ebert A., A User Study on Multivariate Edge Visualizations for Graph-Based Visual Analysis Tasks. 2016 20th International Conference Information Visualisation (IV) (2016), pp. 165-170, doi:10.1109/IV.2016.41.

    Schwank J., Schöffel S., Stärz J., Ebert A., Visualizing Uncertainty of Edge Attributes in Node-Link Diagrams. 2016 20th International Conference Information Visualisation (IV) (2016), pp. 45-50, doi:10.1109/IV.2016.19.