Abstract
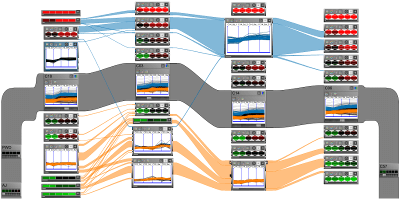
Large volumes of real-world data often exhibit inhomogeneities: vertically in the form of correlated or independent dimensions and horizontally in the form of clustered or scattered data items. In essence, these inhomogeneities form the patterns in the data that researchers are trying to find and understand. Sophisticated statistical methods are available to reveal these patterns, however, the visualization of their outcomes is mostly still performed in a one-view-fits-all manner. In contrast, our novel visualization approach, VisBricks, acknowledges the inhomogeneity of the data and the need for different visualizations that suit the individual characteristics of the different data subsets. The overall visualization of the entire data set is patched together from smaller visualizations, there is one VisBrick for each cluster in each group of interdependent dimensions. Whereas the total impression of all VisBricks together gives a comprehensive high-level overview of the different groups of data, each VisBrick independently shows the details of the group of data it represents. State-of-the-art brushing and visual linking between all VisBricks furthermore allows the comparison of the groupings and the distribution of data items among them. In this paper, we introduce the VisBricks visualization concept, discuss its design rationale and implementation, and demonstrate its usefulness by applying it to a use case from the field of biomedicine.
Citation
Alexander Lex,
Hans-Jörg Schulz,
Marc Streit,
Christian Partl,
Dieter Schmalstieg
VisBricks: Multiform Visualization of Large, Inhomogeneous Data
IEEE Transactions on Visualization and Computer Graphics (InfoVis), 17(12): 2291--2300, doi:10.1109/TVCG.2011.250, 2011.
BibTeX
@article{2011_infovis_visbricks,
  title = {VisBricks: Multiform Visualization of Large, Inhomogeneous Data },
  author = {Alexander Lex and Hans-Jörg Schulz and Marc Streit and Christian Partl and Dieter Schmalstieg},
  journal = {IEEE Transactions on Visualization and Computer Graphics (InfoVis)},
  doi = {10.1109/TVCG.2011.250},
  volume = {17},
  number = {12},
  pages = {2291--2300},
  year = {2011}
}