Abstract
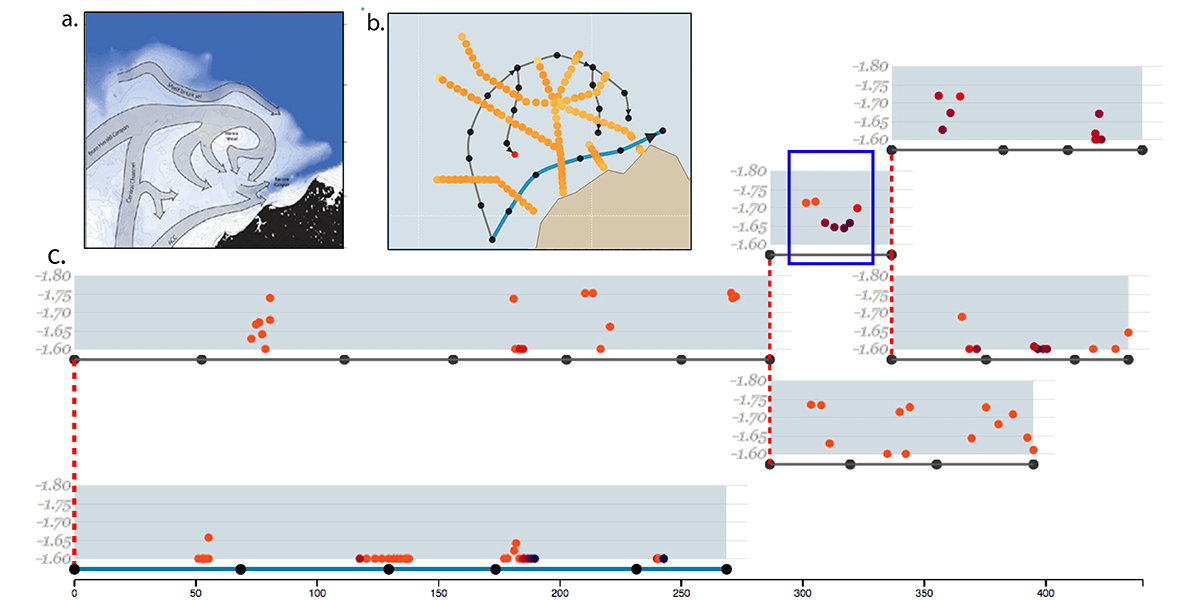
Geographical datasets are ubiquitous in oceanography. While map-based visualizations are useful for many different domains, they can suffer from cluttering and overplotting issues when used for multivariate data sets. As a result, spatial data exploration in oceanography has often been restricted to multiple maps showing various depths or time intervals. This lack of interactive exploration often hinders efforts to expose correlations between properties of oceanographic features, specifically currents. OceanPaths provides powerful interaction and exploration methods for spatial, multivariate oceanography datasets to remedy these situations. Fundamentally, our method allows users to define pathways, typically following currents, along which the variation of the high-dimensional data can be plotted efficiently. We present a case study conducted by domain experts to underscore the usefulness of OceanPaths in uncovering trends and correlations in oceanographic data sets.
Citation
Carolina Nobre,
Alexander Lex
OceanPaths: Visualizing Multivariate Oceanography Data
Proceedings of the Eurographics Conference on Visualization (EuroVis ’15) - Short Papers, doi:10.2312/eurovisshort.20151124, 2015.
BibTeX
@inproceedings{2015_eurovis_oceanpaths,
  title = {OceanPaths: Visualizing Multivariate Oceanography Data},
  author = {Carolina Nobre and Alexander Lex},
  booktitle = {Proceedings of the Eurographics Conference on Visualization (EuroVis ’15) - Short Papers},
  publisher = {The Eurographics Association},
  doi = {10.2312/eurovisshort.20151124},
  year = {2015}
}