Abstract
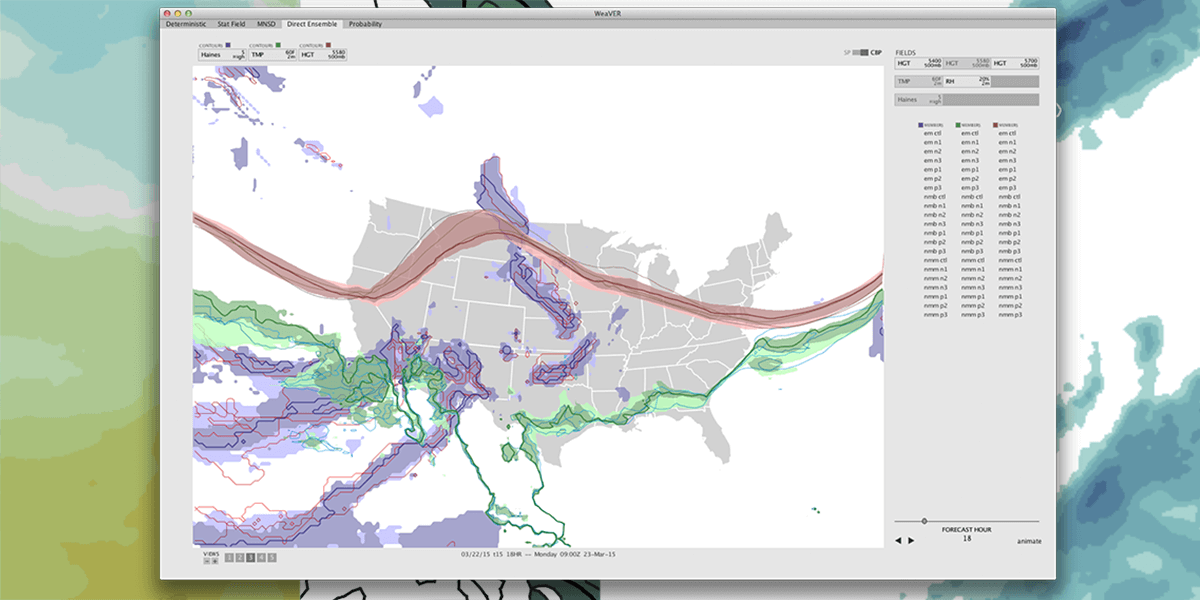
Meteorologists process and analyze weather forecasts using visualization in order to examine the behaviors of and relationships among weather features. In this design study conducted with meteorologists in decision support roles, we identified and attempted to address two significant common challenges in weather visualization: the employment of inconsistent and often ineffective visual encoding practices across a wide range of visualizations, and a lack of support for directly visualizing how different weather features relate across an ensemble of possible forecast outcomes. In this work, we present a characterization of the problems and data associated with meteorological forecasting, we propose a set of informed default encoding choices that integrate existing meteorological conventions with effective visualization practice, and we extend a set of techniques as an initial step toward directly visualizing the interactions of multiple features over an ensemble forecast. We discuss the integration of these contributions into a functional prototype tool, and also reflect on the many practical challenges that arise when working with weather data.
Citation
P. Samuel Quinan,
Miriah Meyer
Visually Comparing Weather Features in Forecasts
IEEE Transactions on Visualization and Computer Graphics (InfoVis ’15), 22(1): 389--398, doi:10.1109/TVCG.2015.2467754, 2016.
BibTeX
@article{2015_infovis_weaver,
  title = {Visually Comparing Weather Features in Forecasts},
  author = {P. Samuel Quinan and Miriah Meyer},
  journal = {IEEE Transactions on Visualization and Computer Graphics (InfoVis ’15)},
  doi = {10.1109/TVCG.2015.2467754},
  volume = {22},
  number = {1},
  pages = {389--398},
  month = {jan},
  year = {2016}
}