Abstract
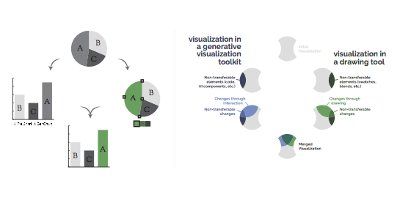
A common workflow for visualization designers begins with a generative tool, like D3 or Processing, to create the initial visualization; and proceeds to a drawing tool, like Adobe Illustrator or Inkscape, for editing and cleaning. Unfortunately, this is typically a one-way process: once a visualization is exported from the generative tool into a drawing tool, it is difficult to make further, data-driven changes. In this paper, we propose a bridge model to allow designers to bring their work back from the drawing tool to re-edit in the generative tool. Our key insight is to recast this iteration challenge as a merge problem - similar to when two people are editing a document and changes between them need to reconciled. We also present a specific instantiation of this model, a tool called Hanpuku, which bridges between D3 scripts and Illustrator. We show several examples of visualizations that are iteratively created using Hanpuku in order to illustrate the flexibility of the approach. We further describe several hypothetical tools that bridge between other visualization tools to emphasize the generality of the model.
Citation
Alex Bigelow,
Steven Drucker,
Danyel Fisher,
Miriah Meyer
Iterating Between Tools to Create and Edit Visualizations
IEEE Transactions on Visualization and Computer Graphics (InfoVis), 23(1): 481--490, doi:10.1109/TVCG.2016.2598609, 2016.
BibTeX
@article{2016_infovis_hanpuku,
  title = {Iterating Between Tools to Create and Edit Visualizations},
  author = {Alex Bigelow and Steven Drucker and Danyel Fisher and Miriah Meyer},
  journal = {IEEE Transactions on Visualization and Computer Graphics (InfoVis)},
  doi = {10.1109/TVCG.2016.2598609},
  url = {http://ieeexplore.ieee.org/document/7539580/},
  volume = {23},
  number = {1},
  pages = {481--490},
  year = {2016}
}