Abstract
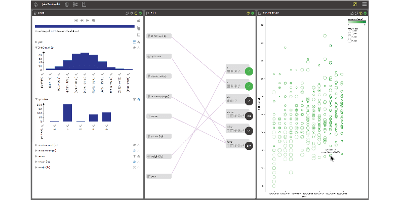
Visualization practitioners are constantly developing new, innovative ways to visualize data, but much of the software that practitioners produce does not make it into production in professional systems. To solve this problem, we have developed and informally tested two open source systems. The first, Candela, is a framework and API for creating visualization components for the web that can wrap up new or existing visualizations as needed. Because Candela’s API generalizes the inputs to a visualization, we have also developed a system called Resonant Laboratory that makes it possible for novice users to connect arbitrary datasets to Candela visualizations. Together, these systems enable novice users to explore and share their data with the growing library of state-of-the-art visualization techniques.
Citation
Alex Bigelow,
Roni Choudhury,
Jeffrey Baumes
Note: Selected for oral presentation
Resonant Laboratory and Candela: Spreading Your Visualization Ideas to the Masses
Proceedings of Workshop on Visualization in Practice (VIP), 2016.
VIP 2016 Best Paper Award
BibTeX
@inproceedings{2016_vip_resonant_lab,
  title = {Resonant Laboratory and Candela: Spreading Your Visualization Ideas to the Masses},
  author = {Alex Bigelow and Roni Choudhury and Jeffrey Baumes},
  booktitle = {Proceedings of Workshop on Visualization in Practice (VIP)},
  year = {2016}
}
