Abstract
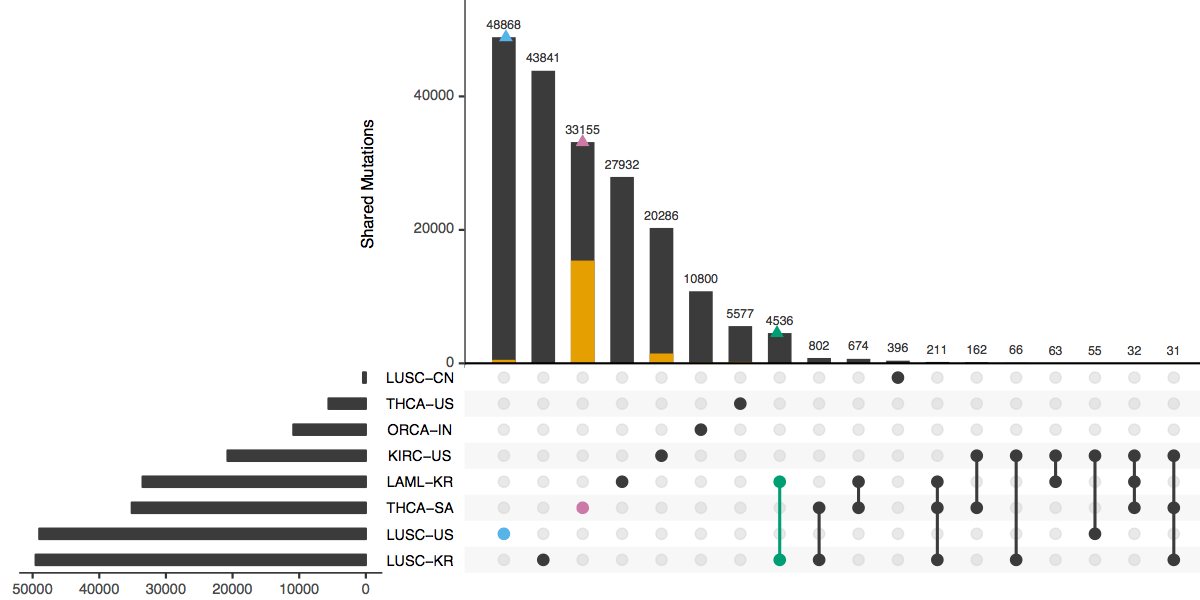
Venn and Euler diagrams are a popular yet inadequate solution for quantitative visualization of set intersections. A scalable alternative to Venn and Euler diagrams for visualizing intersecting sets and their properties is needed. We developed UpSetR, an open source R package that employs a scalable matrix-based visualization to show intersections of sets, their size, and other properties. UpSetR is available at https://cran.r-project.org/package=UpSetR and released under the MIT License. A Shiny app is available at https://gehlenborglab.shinyapps.io/upsetr.
Citation
Jake R. Conway,
Alexander Lex,
Nils Gehlenborg
UpSetR: An R Package For The Visualization Of Intersecting Sets And Their Properties
Bioinformatics, 33(18): 2938-2940, doi:10.1093/bioinformatics/btx364, 2017.
BibTeX
@article{2017_bioinformatics_upsetr,
  title = {UpSetR: An R Package For The Visualization Of Intersecting Sets And Their Properties},
  author = {Jake R. Conway and Alexander Lex and Nils Gehlenborg},
  journal = {Bioinformatics},
  doi = {10.1093/bioinformatics/btx364},
  volume = {33},
  number = {18},
  pages = {2938-2940},
  year = {2017}
}
Acknowledgements
The authors would like to thank Megan Paul for her contributions to the project. This work was funded through awards by the National Institutes of Health (R00HG007583, U54HG007963, U01CA198935).