Abstract
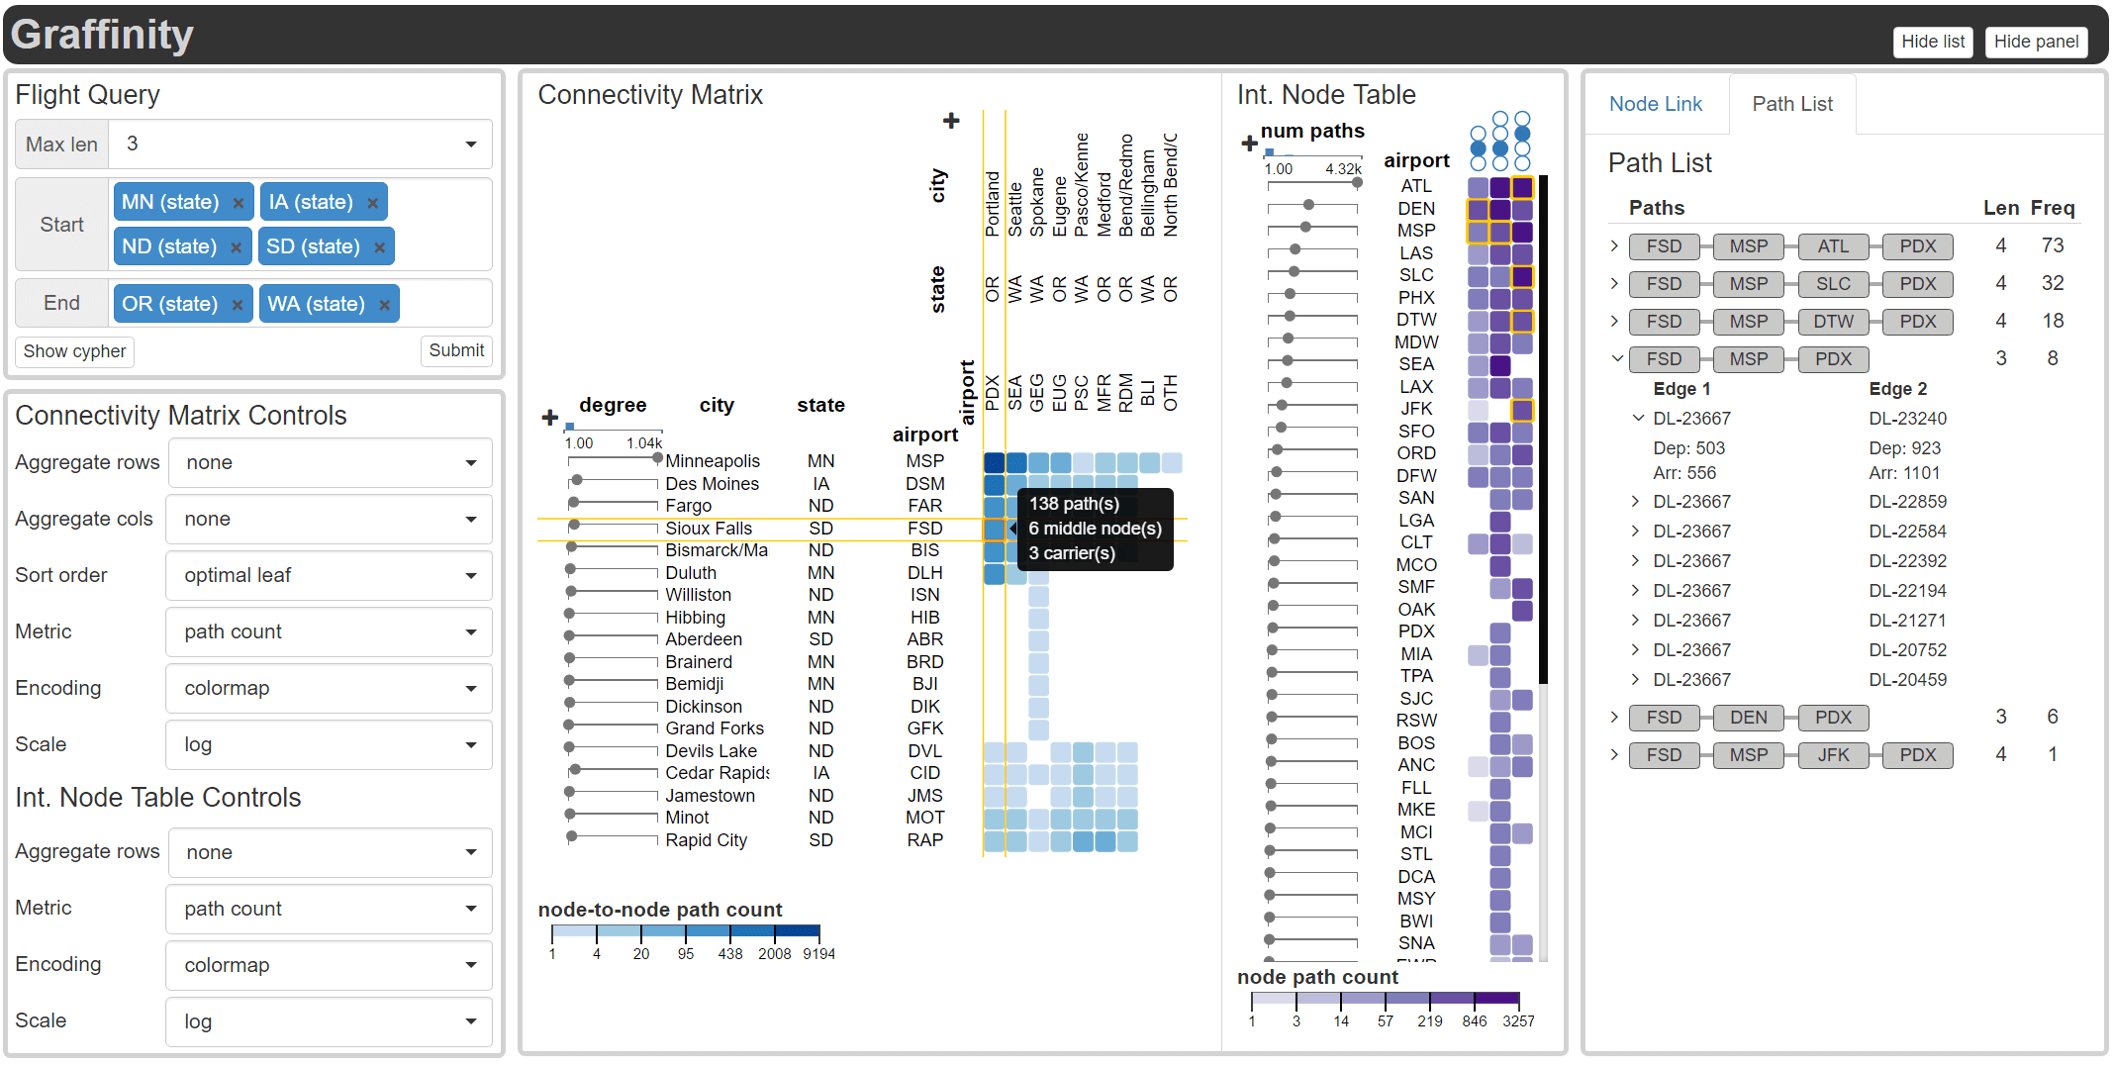
Multivariate graphs are prolific across many fields, including transportation and neuroscience. A key task in graph analysis is the exploration of connectivity, to, for example, analyze how signals flow through neurons, or to explore how well different cities are connected by flights. While standard node-link diagrams are helpful in judging connectivity, they do not scale to large networks. Adjacency matrices also do not scale to large networks and are only suitable to judge connectivity of adjacent nodes. A key approach to realize scalable graph visualization are queries: instead of displaying the whole network, only a relevant subset is shown. Query-based techniques for analyzing connectivity in graphs, however, can also easily suffer from cluttering if the query result is big enough. To remedy this, we introduce techniques that provide an overview of the connectivity and reveal details on demand.We have two main contributions: (1) two novel visualization techniques that work in concert for summarizing graph connectivity; and (2) Graffinity, an open-source implementation of these visualizations supplemented by detail views to enable a complete analysis workflow. Graffinity was designed in a close collaboration with neuroscientists and is optimized for connectomics data analysis, yet the technique is applicable across domains. We validate the connectivity overview and our open-source tool with illustrative examples using flight and connectomics data.
Citation
Ethan Kerzner,
Alexander Lex,
Crystal Lynn Sigulinsky,
Timothy Urness,
Bryan William Jones,
Robert E. Marc,
Miriah Meyer
Graffinity: Visualizing Connectivity In Large Graphs
Computer Graphics Forum (EuroVis), 36(3): 251-260, doi:10.1111/cgf.13184, 2017.
BibTeX
@article{2017_eurovis_graffinity,
  title = {Graffinity: Visualizing Connectivity In Large Graphs},
  author = {Ethan Kerzner and Alexander Lex and Crystal Lynn Sigulinsky and Timothy Urness and Bryan William Jones and Robert E. Marc and Miriah Meyer},
  journal = {Computer Graphics Forum (EuroVis)},
  doi = {10.1111/cgf.13184},
  volume = {36},
  number = {3},
  pages = {251-260},
  pmcid = {PMC5821473},
  year = {2017}
}
Acknowledgements
This work was supported in part by NSF grant IIS-1350896, NIH U01 CA198935, the DoD - Office of Economic Adjustment (OEA) ST1605-16-01, NIH EY015128, EY02576, and EY014800 Vision Core, an unrestricted grant from Research to Prevent Blindness to the Moran Eye Center.