Abstract
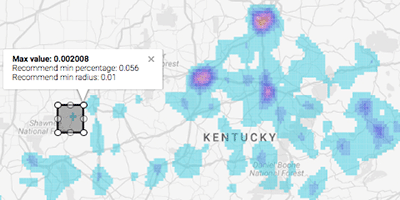
The size of large, geo-located datasets has reached scales where visualization of all data points is inefficient. Random sampling is a method to reduce the size of a dataset, yet it can introduce unwanted errors. We describe a method for subsampling of spatial data suitable for creating kernel density estimates from very large data and demonstrate that it results in less error than random sampling. We also introduce a method to ensure that thresholding of low values based on sampled data does not omit any regions above the desired threshold when working with sampled data. We demonstrate the effectiveness of our approach using both, artificial and real-world large geospatial datasets.
Citation
Yan Zheng,
Yi Ou,
Alexander Lex,
Jeff M. Phillips
Visualization of Big Spatial Data using Coresets for Kernel Density Estimates
IEEE Symposium on Visualization in Data Science (VDS), doi:10.1109/VDS.2017.8573446, 2017.
BibTeX
@inproceedings{2017_vds_coresets,
  title = {Visualization of Big Spatial Data using Coresets for Kernel Density Estimates},
  author = {Yan Zheng and Yi Ou and Alexander Lex and Jeff M. Phillips},
  booktitle = {IEEE Symposium on Visualization in Data Science (VDS)},
  doi = {10.1109/VDS.2017.8573446},
  publisher = {IEEE},
  year = {2017}
}
Note
This is a workshop paper which was extended to a journal paper. Please refer to and cite the journal paper instead.
Acknowledgements
Thanks to support by NSF CCF-1350888, IIS-1251019, ACI-1443046, CNS-1514520, CNS-1564287 and NIH U01 CA198935.
