Abstract
The analysis of multiple time series and associated quantitative or categorical attributes is an important task. Air pollution data, for example, is captured along many dimensions. This data is valuable for studying the association between air quality and diseases risks. In these cases, researchers need to view a large amount of data for multiple cases simultaneously, limiting the space that is available for each time series.
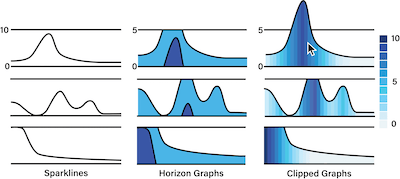
In this abstract, we introduce clipped graphs, a hybrid clipped area chart that uses redundant color coding for visualizing time series data with skewed distributions and relatively rare peaks. We designed clipped graphs for use in compact tabular layouts. We use binned color scales for the full data range but clip outliers above a pre-defined threshold. The clipped peaks can be revealed through interaction. We integrate clipped graphs into an existing multivariate data visualization system, which visualizes clinical genealogies and detailed data about individuals in a tabular layout.
Citation
Haihan Lin,
Carolina Nobre,
Amanda Bakian,
Alexander Lex
Clipped Graphs: A Compact Time-Series Encoding
Proceedings of the IEEE Information Visualization Conference – Posters (InfoVis), 2019.
BibTeX
@inproceedings{2019_infovis_clipped_graphs,
  title = {Clipped Graphs: A Compact Time-Series Encoding},
  author = {Haihan Lin and Carolina Nobre and Amanda Bakian and Alexander Lex},
  booktitle = {Proceedings of the IEEE Information Visualization Conference – Posters (InfoVis)},
  year = {2019}
}
Acknowledgements
We thank our collaborators and the Visualization Design Lab at the University of Utah for the feedback. This work was supported by the Utah Genome Project, and the National Science Foundation (OAC 1835904). We thank the Pedigree and Population Resource of the Huntsman Cancer Institute, University of Utah (funded in part by the Huntsman Cancer Foundation) for its role in the ongoing collection, maintenance, and support of the Utah Population Database (UPDB). We also acknowledge support for the UPDB through grant P30 CA2014 from the National Cancer Institute, and from the University of Utah’s Program in Personalized Health and Center for Clinical and Translational Science.