Abstract
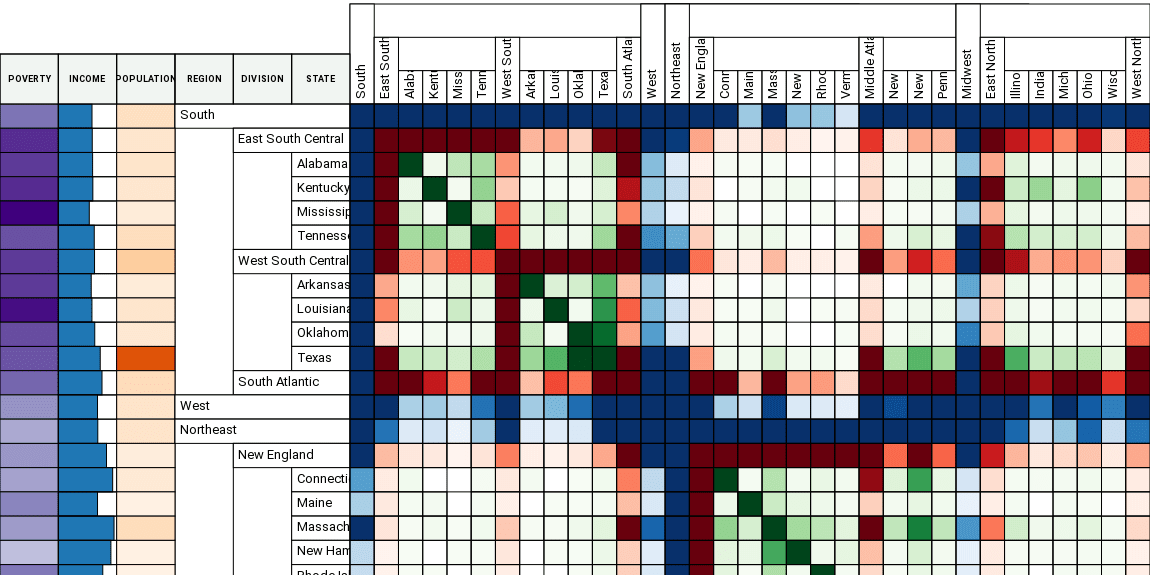
Considering node and edge attribute is crucial for many network exploration and analysis tasks. However, effective visualization of both structure and attributes is a challenging problem, especially for dense graphs. In this poster, we introduce TaMax, a technique designed to visualize dense multivariate graphs with a diverse set of node and edge attributes based on adjacency matrices. In TaMax, node attributes are visualized in a table that is juxtaposed with the matrix, while edge attributes visualized in the cells. We investigate different ways to visualize multiple edge attributes: dividing each cells into sub-cells showing different edge attributes or overlaying a secondary attribute with opacity over a cell. Furthermore, TaMax addresses the scalability problem by allowing flexible grouping based on node attributes and querying based on edge attributes.
Citation
Ilkin Safarli,
Alexander Lex
TaMax: Visualizing Dense Multivariate Networks with Adjacency Matrices
Proceedings of the IEEE Information Visualization Conference – Posters (InfoVis ’19), 2019.
BibTeX
@inproceedings{2019_infovis_tamax,
  title = {TaMax: Visualizing Dense Multivariate Networks with Adjacency Matrices},
  author = {Ilkin Safarli and Alexander Lex},
  booktitle = {Proceedings of the IEEE Information Visualization Conference – Posters (InfoVis ’19)},
  year = {2019}
}