Abstract
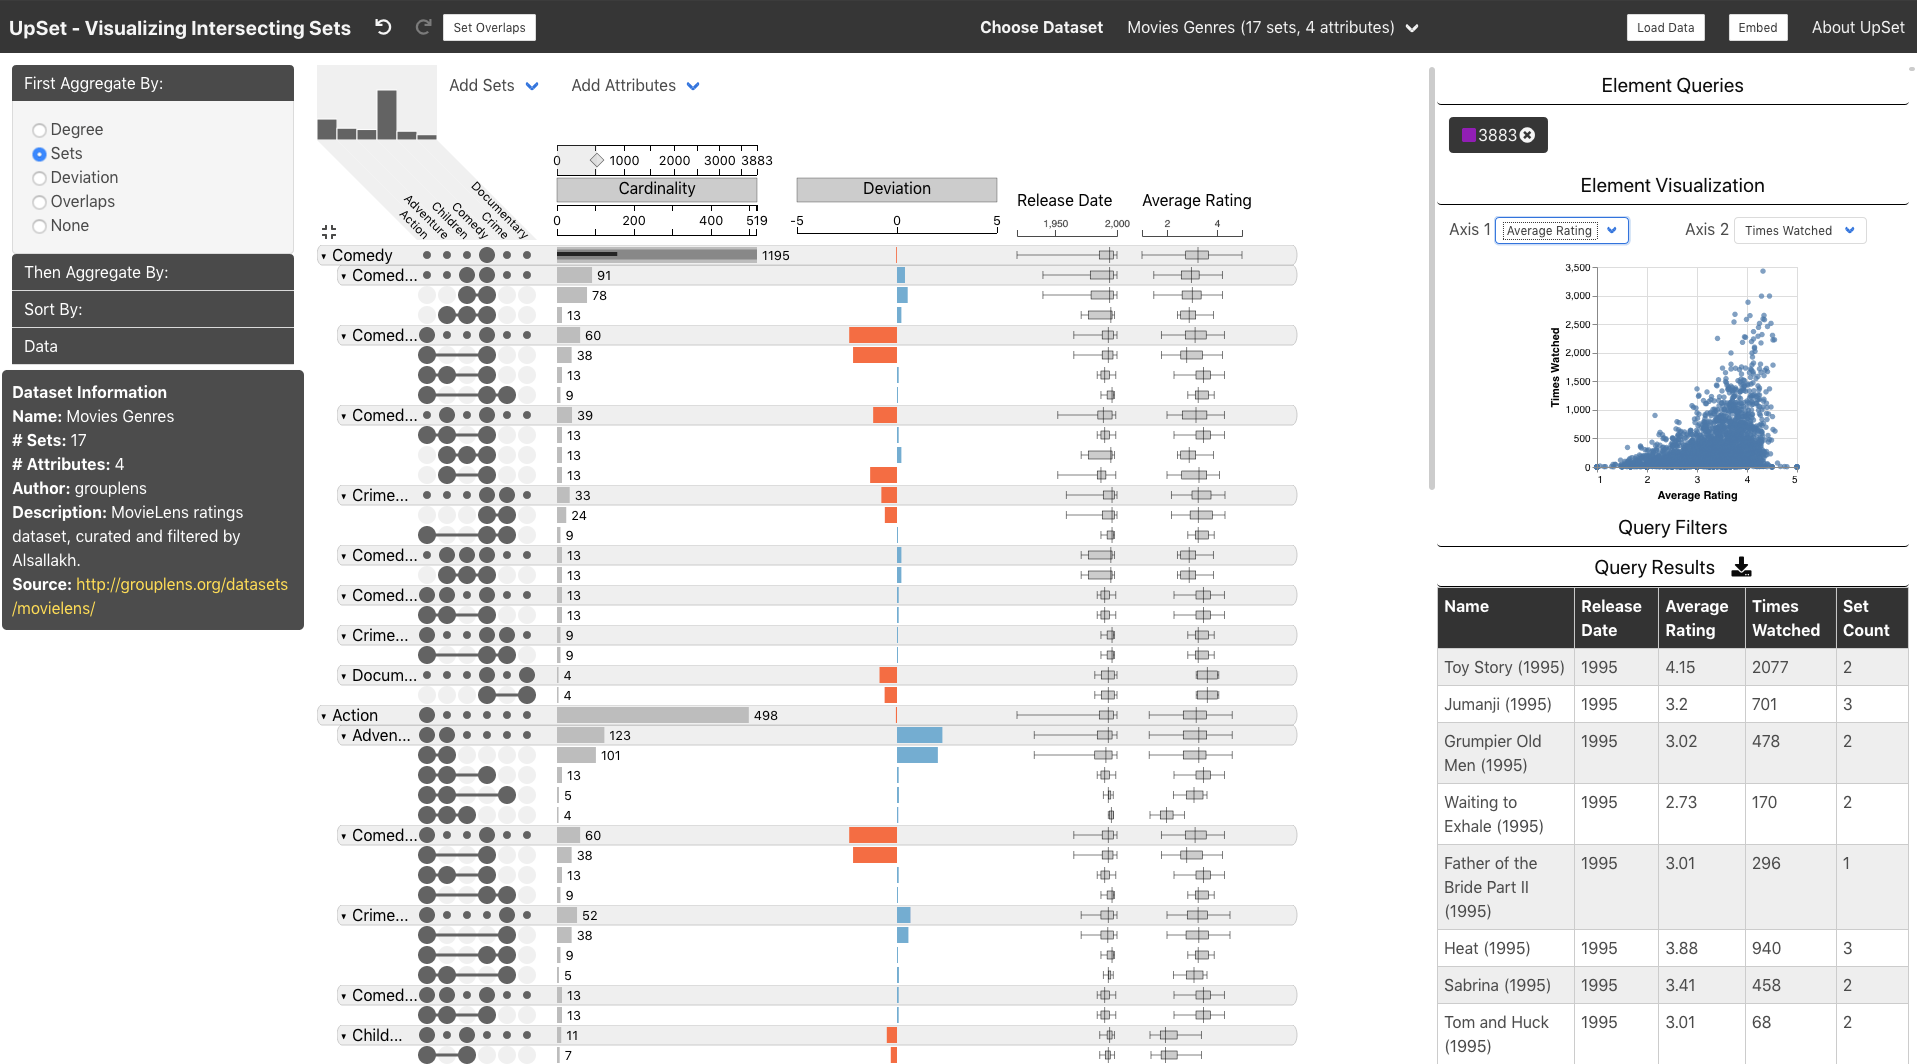
UpSet is a technique for visualization and analysis of sets and their intersections which was introduced at InfoVis 2014. The technique visualizes the elements and their set memberships in a matrix layout along with an aligned bar chart to display intersection sizes. As the approach provides a more accurate representation of the size of set intersections and scales better with respect to the number of sets than other approaches, UpSet plots are frequently used in papers in the biomedical domain. However, we believe that this popularity is mostly due to an R version that generates UpSet figures, and not because of our interactive JavaScript implementation that was published with the original paper. Why is the R version more popular? We believe it has multiple reasons, but one of them is that the original tool is an academic prototype, with the usual shortcomings for practical use. This poster presents a new version of UpSet---a tool that was developed to address requests for additional functionality over the original implementation based on user feedback. We describe in detail which changes we undertook to improve the paper prototype into a tool. The new version adds features to improve adoption, improve sharing insights, and allow customization. For example, it allows embedding of the tool in webpages and supports tracking of provenance to provide a undo and redo functionality. The new implementation also can be used as a JavaScript/TypeScript library, which makes it easy to integrate UpSet in larger systems.
Citation
Kiran Gadhave,
Hendrik Strobelt,
Nils Gehlenborg,
Alexander Lex
UpSet 2: From Prototype to Tool
Proceedings of the IEEE Information Visualization Conference – Posters (InfoVis ’19), 2019.
BibTeX
@inproceedings{2019_infovis_upset,
  title = {UpSet 2: From Prototype to Tool },
  author = {Kiran Gadhave and Hendrik Strobelt and Nils Gehlenborg and Alexander Lex},
  booktitle = {Proceedings of the IEEE Information Visualization Conference – Posters (InfoVis ’19)},
  year = {2019}
}