Abstract
Iteration is a ubiquitous need across many different visualization design workflows. For visual design, practitioners often need to transition between the automated generation of visuals and manual drawing; however, existing software makes free-form iteration between these modalities difficult or impossible. A similar challenge exists for data as well: data abstractions often need to be adjusted; however, many data reshaping operations— particularly graph wrangling operations—have support only in programming environments that may not be accessible to many visualization designers.
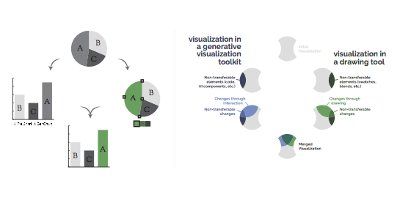
This dissertation begins with an effort to better understand how graphic designers, a specific subset of the broader visualization community, work with data. The lessons from that effort inspire our remaining contributions, which are directed toward the broader community of visualization practitioners: first, we present a software model and a system that make it possible to iterate between drawing and generative visualization. Second, we present a visual technique that enables inquiry into the relationship between two specific graph data wrangling operations: pivoting and filtering. Finally, we present an interface that supports a broader range of graph data wrangling operations that enable iteration between many different graph data abstractions.
Citation
Alex Bigelow
Reflections, Models, and Software for Iterative Visualization Design
Advisors: Miriah Meyer, Alexander Lex, Megan Monroe, James A. Agutter, Tamara Denning
University of Utah, PhD Thesis, May 2019.
BibTeX
@phdthesis{2019-thesis-bigelow,
  title = {Reflections, Models, and Software for Iterative Visualization Design},
  author = {Alex Bigelow},
  school = {University of Utah},
  month = {May},
  year = {2019}
}
