Abstract
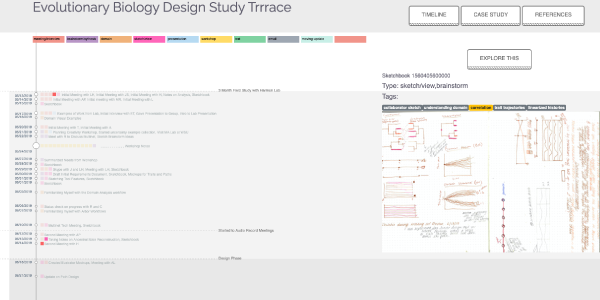
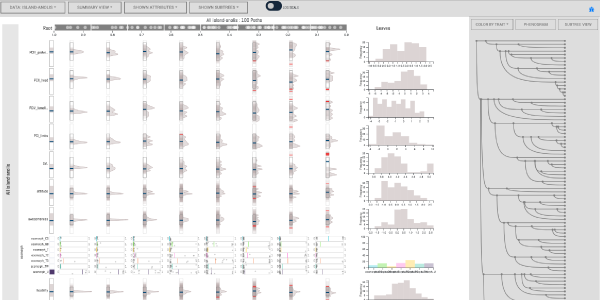
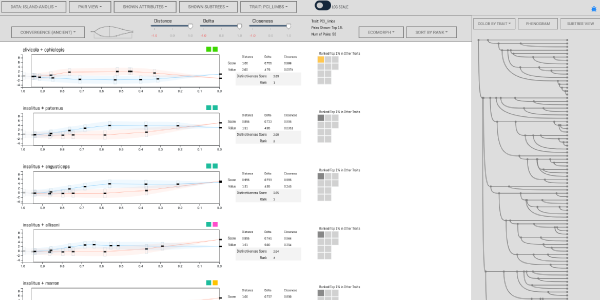
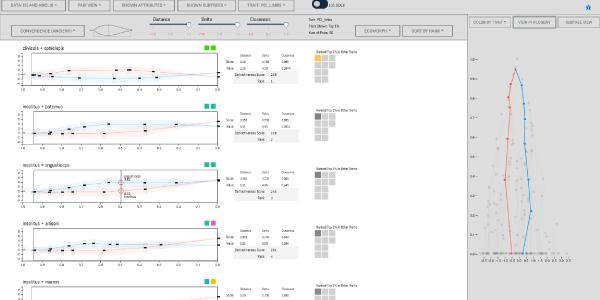
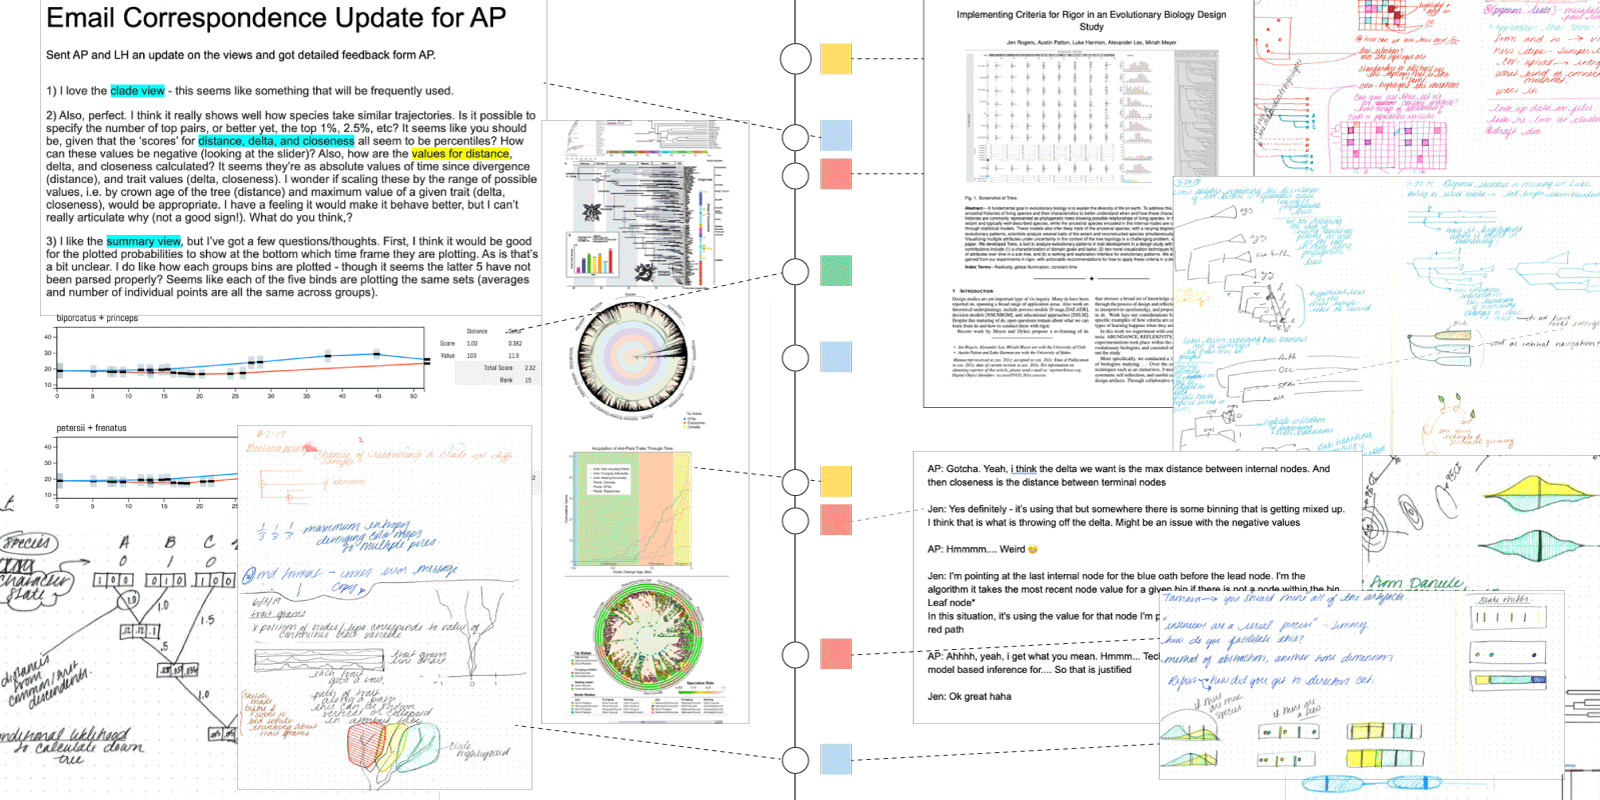
Design study is an established approach of conducting problem-driven visualization research. The academic visualization community has produced a large body of work for reporting on design studies, informed by a handful of theoretical frameworks, and applied to a broad range of application areas. The result is an abundance of reported insights into visualization design, with an emphasis on novel visualization techniques and systems as the primary contribution of these studies. In recent work we proposed a new, interpretivist perspective on design study and six companion criteria for rigor that highlight the opportunities for researchers to contribute knowledge that extends beyond visualization idioms and software. In this work we conducted a year-long collaboration with evolutionary biologists to develop an interactive tool for visual exploration of multivariate datasets and phylogenetic trees. During this design study we experimented with methods to support three of the rigor criteria: ABUNDANT, REFLEXIVE, and TRANSPARENT. As a result we contribute two novel visualization techniques for the analysis of multivariate phylogenetic datasets, three methodological recommendations for conducting design studies drawn from reflections over our process of experimentation, and two writing devices for reporting interpretivist design study. We offer this work as an example for implementing the rigor criteria to produce a diverse range of knowledge contributions.
Citation
Jen Rogers,
Austin H Patton,
Luke Harmon,
Alexander Lex,
Miriah Meyer
Insights From Experiments With Rigor in an EvoBio Design Study
IEEE Transactions on Visualization and Computer Graphics (InfoVis), 27(2): 1106-1116, doi:10.1109/TVCG.2020.3030405, 2021.
BibTeX
@article{2020_infovis_insights,
  title = {Insights From Experiments With Rigor in an EvoBio Design Study},
  author = {Jen Rogers and Austin H Patton and Luke Harmon and Alexander Lex and Miriah Meyer},
  journal = {IEEE Transactions on Visualization and Computer Graphics (InfoVis)},
  publisher = {IEEE},
  doi = {10.1109/TVCG.2020.3030405},
  volume = {27},
  number = {2},
  pages = {1106-1116},
  month = {Feb.},
  year = {2021}
}
Acknowledgements
We thank the members of the Harmon lab, the Visualization Design Lab, and the MultiNet team for their participation, feedback, and support. We also appreciate the thoughtful comments from the anonymous reviewers that helped to strengthen this paper. We gratefully acknowledge funding by the National Science Foundation (OAC 1835904).
Images
These images are not part of the original paper and licensed using CC BY 4.0. If you use these images, please cite the paper. Click on the images for full resolution.
