Abstract
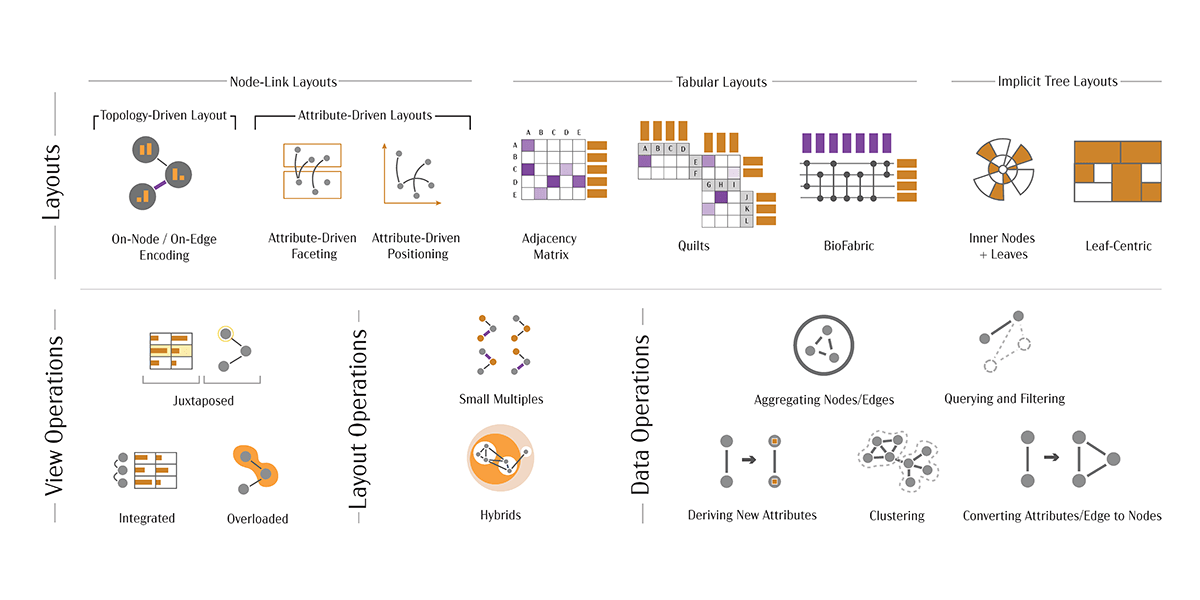
A multivariate network is one in which the nodes and/or edges are associated with attributes. This type of network is widespread, with examples including social networks, physical networks such as power grids, networks modeling cellular processes in biology, and trees describing evolutionary relationships between species. The need for visualizing MVNs arises when the structure (the topology) of the network needs to be analyzed together with the node or edge attributes. Such analysis presents a challenge when visualizing topology and attributes in the same view, since choosing efficient encodings for one aspect often interferes with the ability to effectively visualize the other.Our work contributes to the space of multivariate network visualization by first organizing the design space of MVN visualization techniques into a typology and identifying the limits of existing approaches. Given this landscape of techniques, we make two technique contributions: 1) an applied design study with domain experts that explores visualizing attributed genealogies; and 2) a general MVN visualization approach that addresses the challenge of simultaneously visualizing topology and attributes. We also contribute an empirical study that provides experimental evidence concerning the performance of the two most commonly used MVN visualization techniques: node-link diagrams and adjacency matrices. This body of work will provide guidance for practitioners, visualization researchers, and domain experts using MVNs for real world exploration.
Citation
Carolina Nobre
Visualizing Multivariate Networks
Advisors: Alexander Lex, Miriah Meyer, Jason Wiese, Nils Gehlenborg, Marc Streit
University of Utah, PhD Thesis, May 2020.
BibTeX
@phdthesis{2020-thesis-nobre,
  title = {Visualizing Multivariate Networks},
  author = {Carolina Nobre},
  school = {University of Utah},
  month = {May},
  year = {2020}
}