Abstract
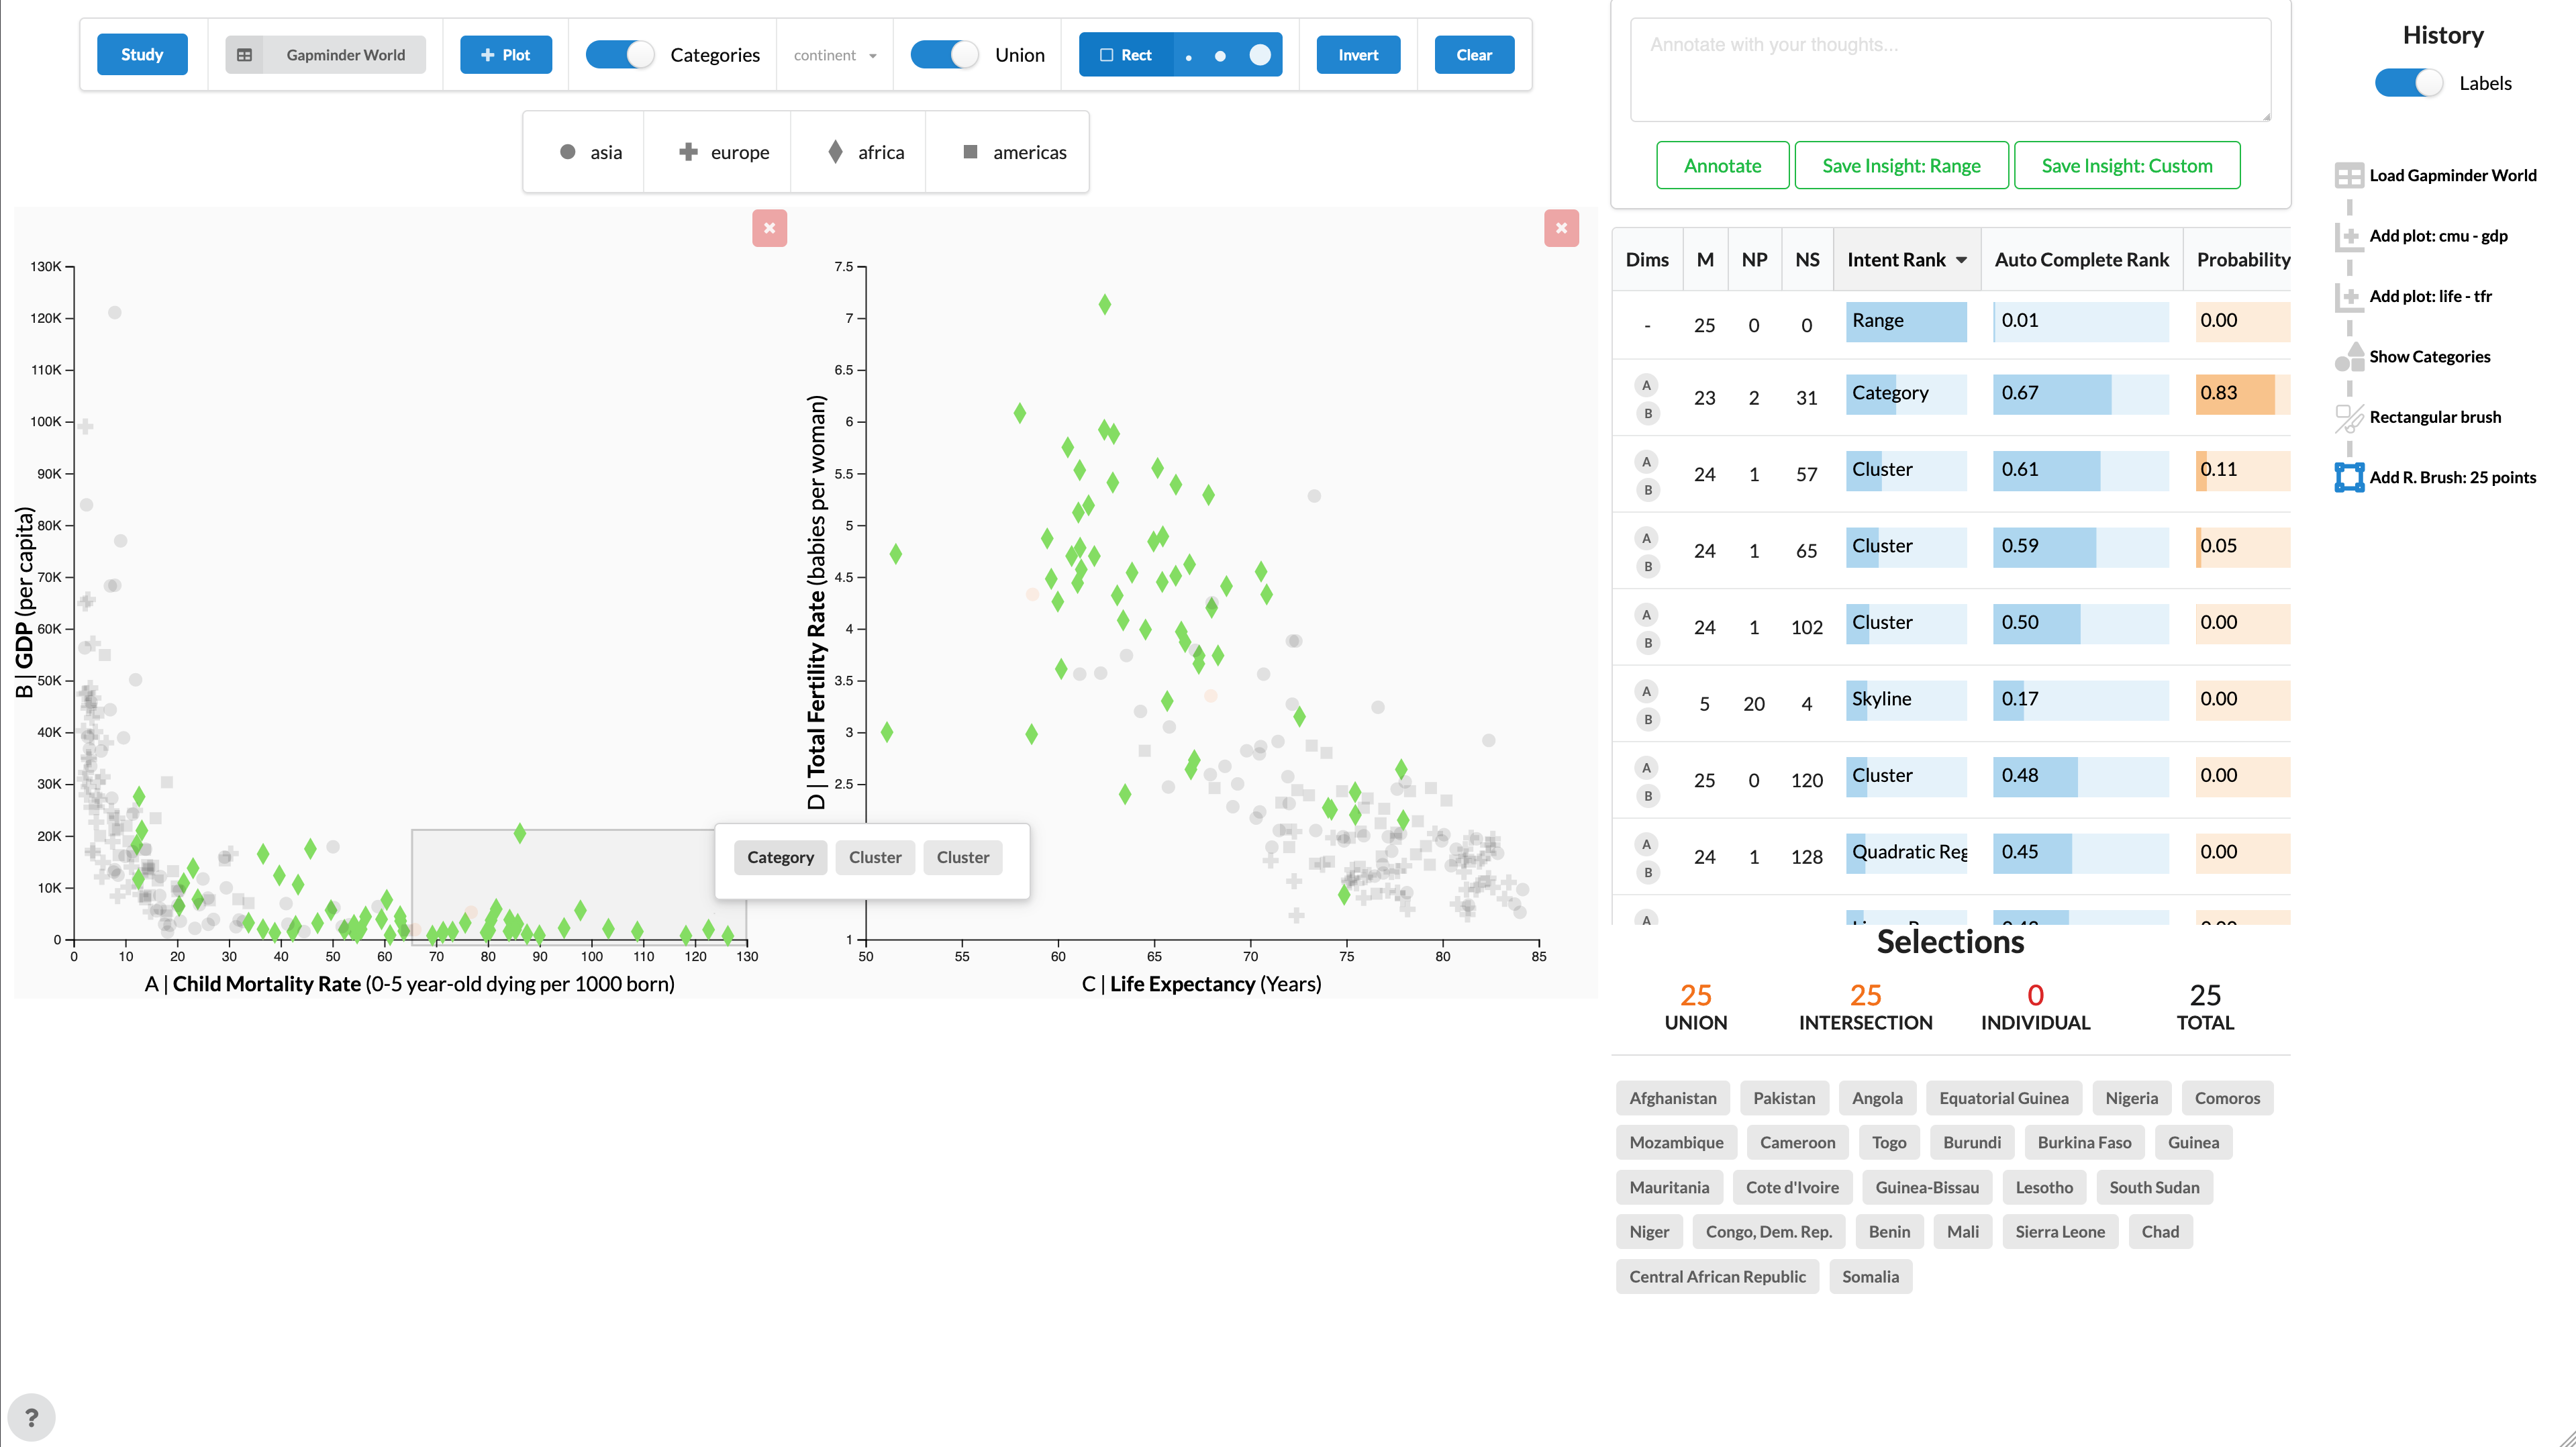
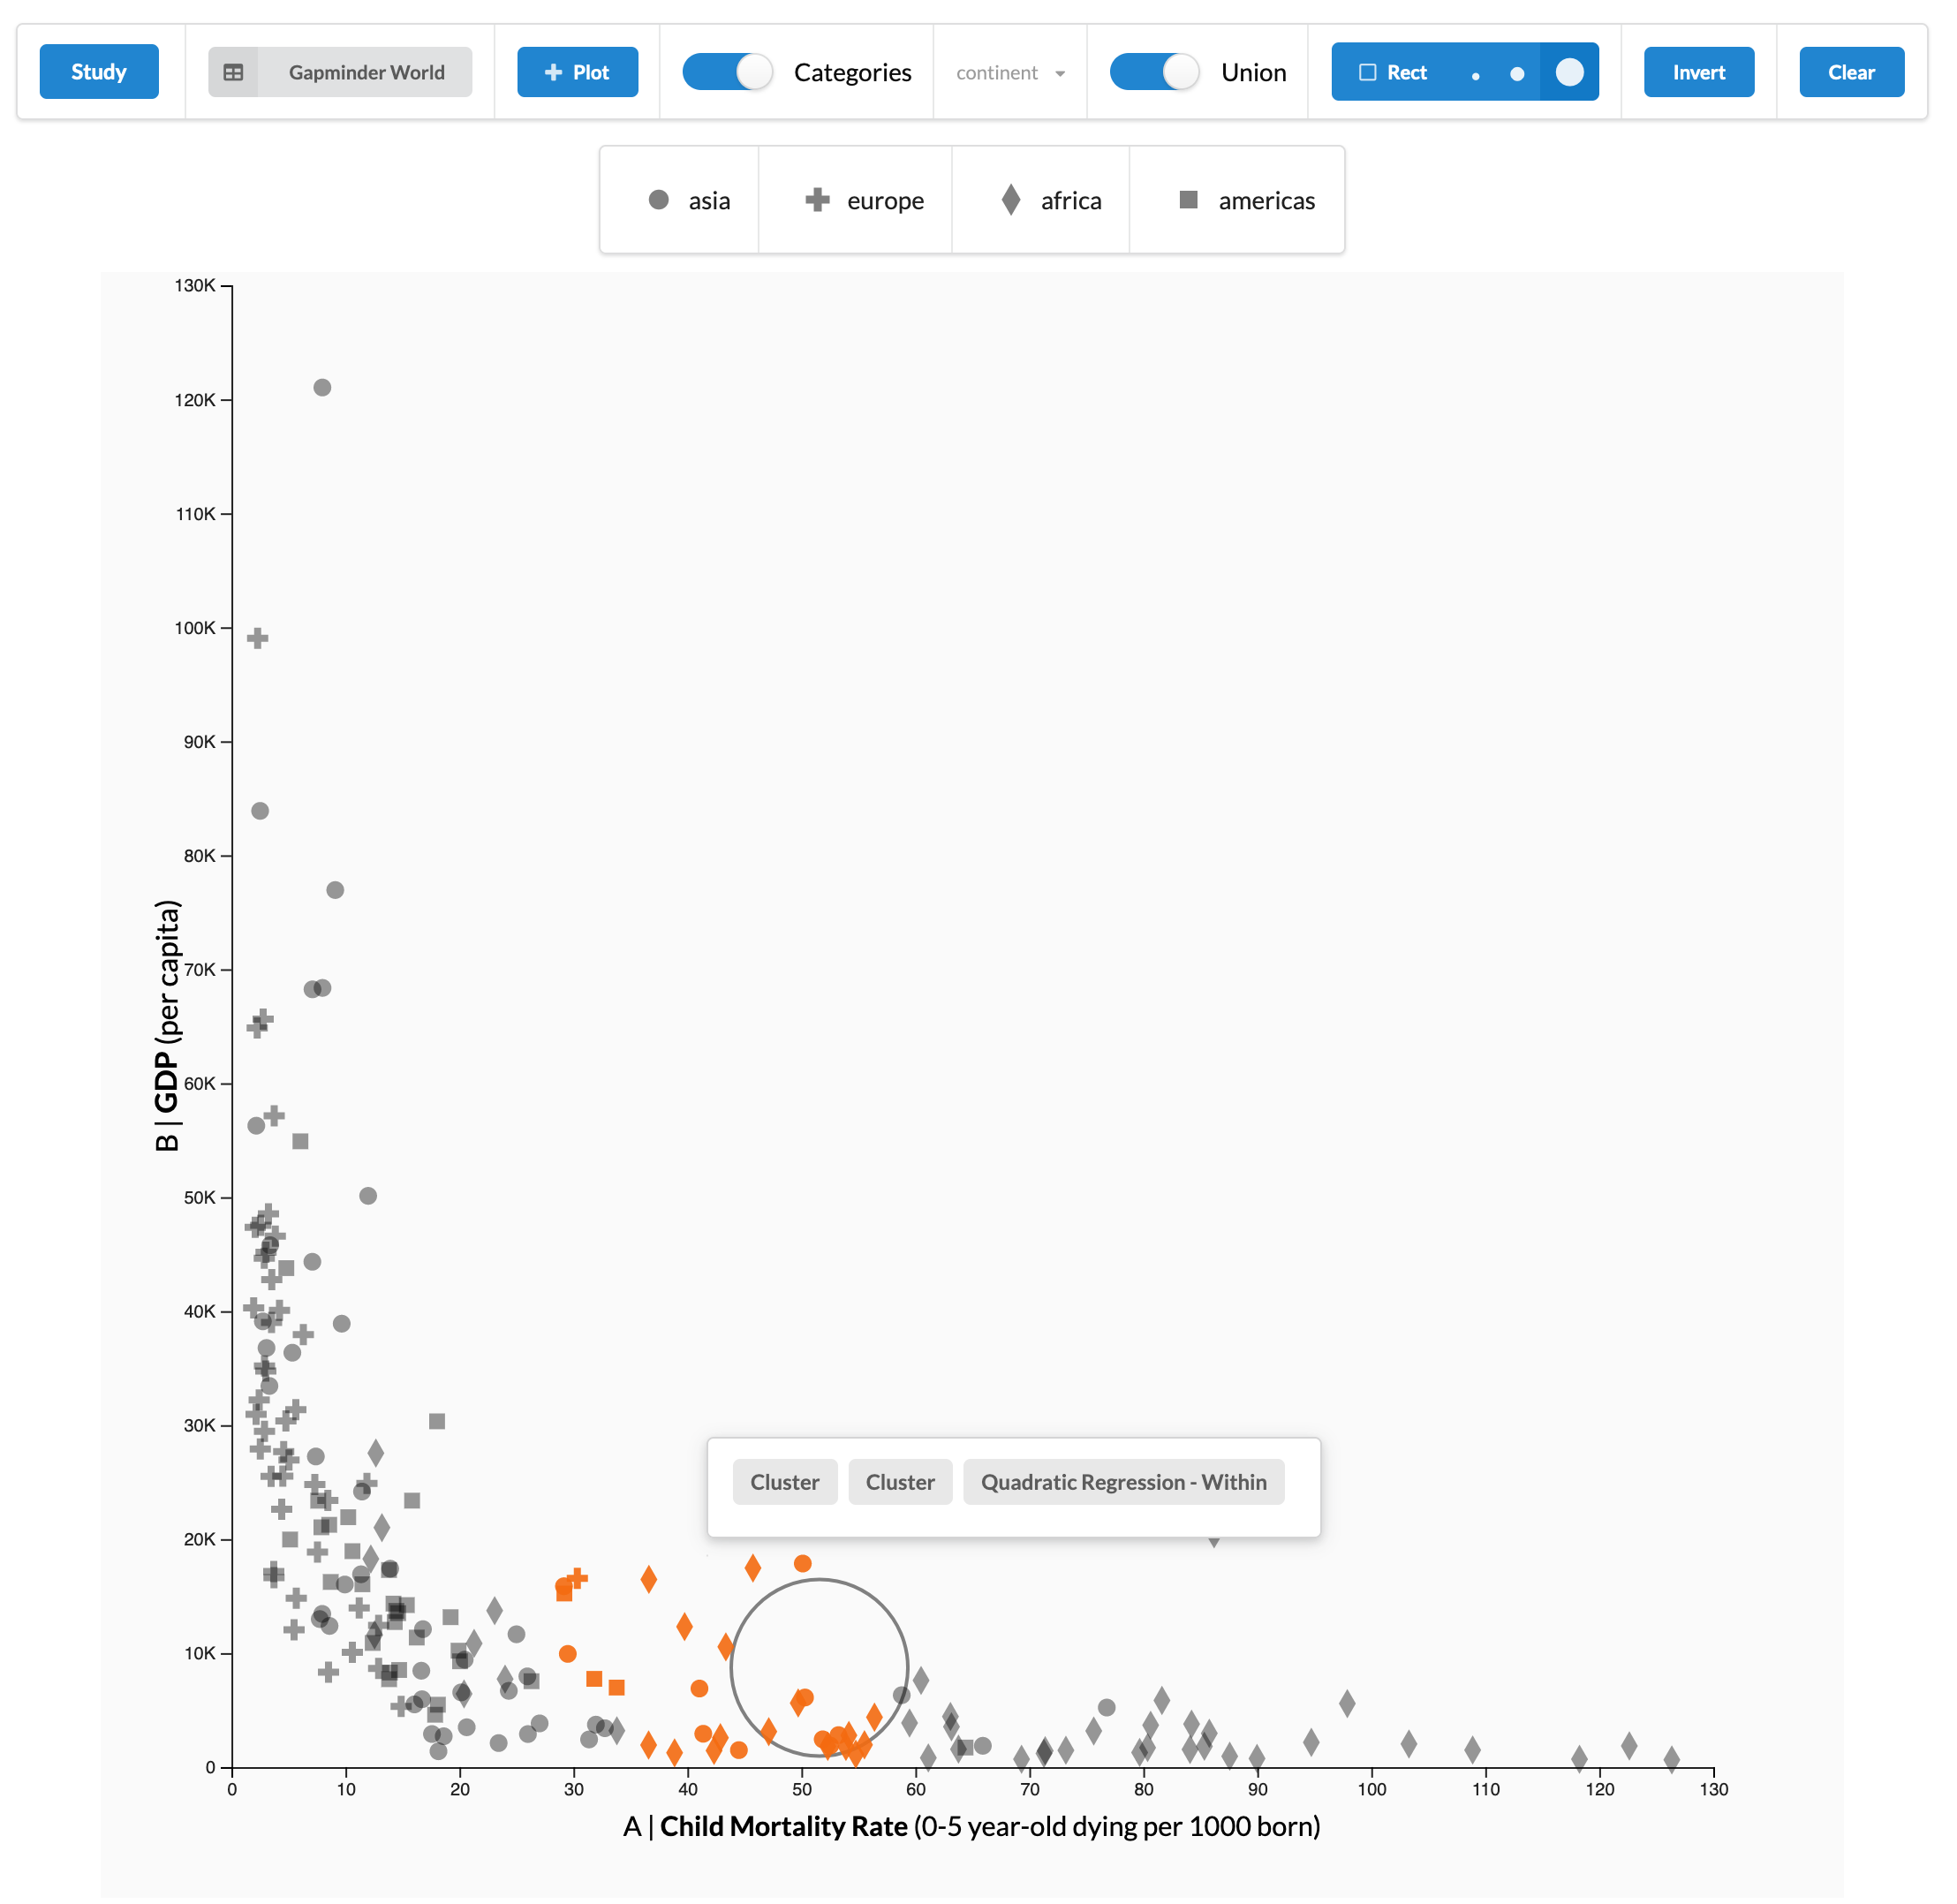
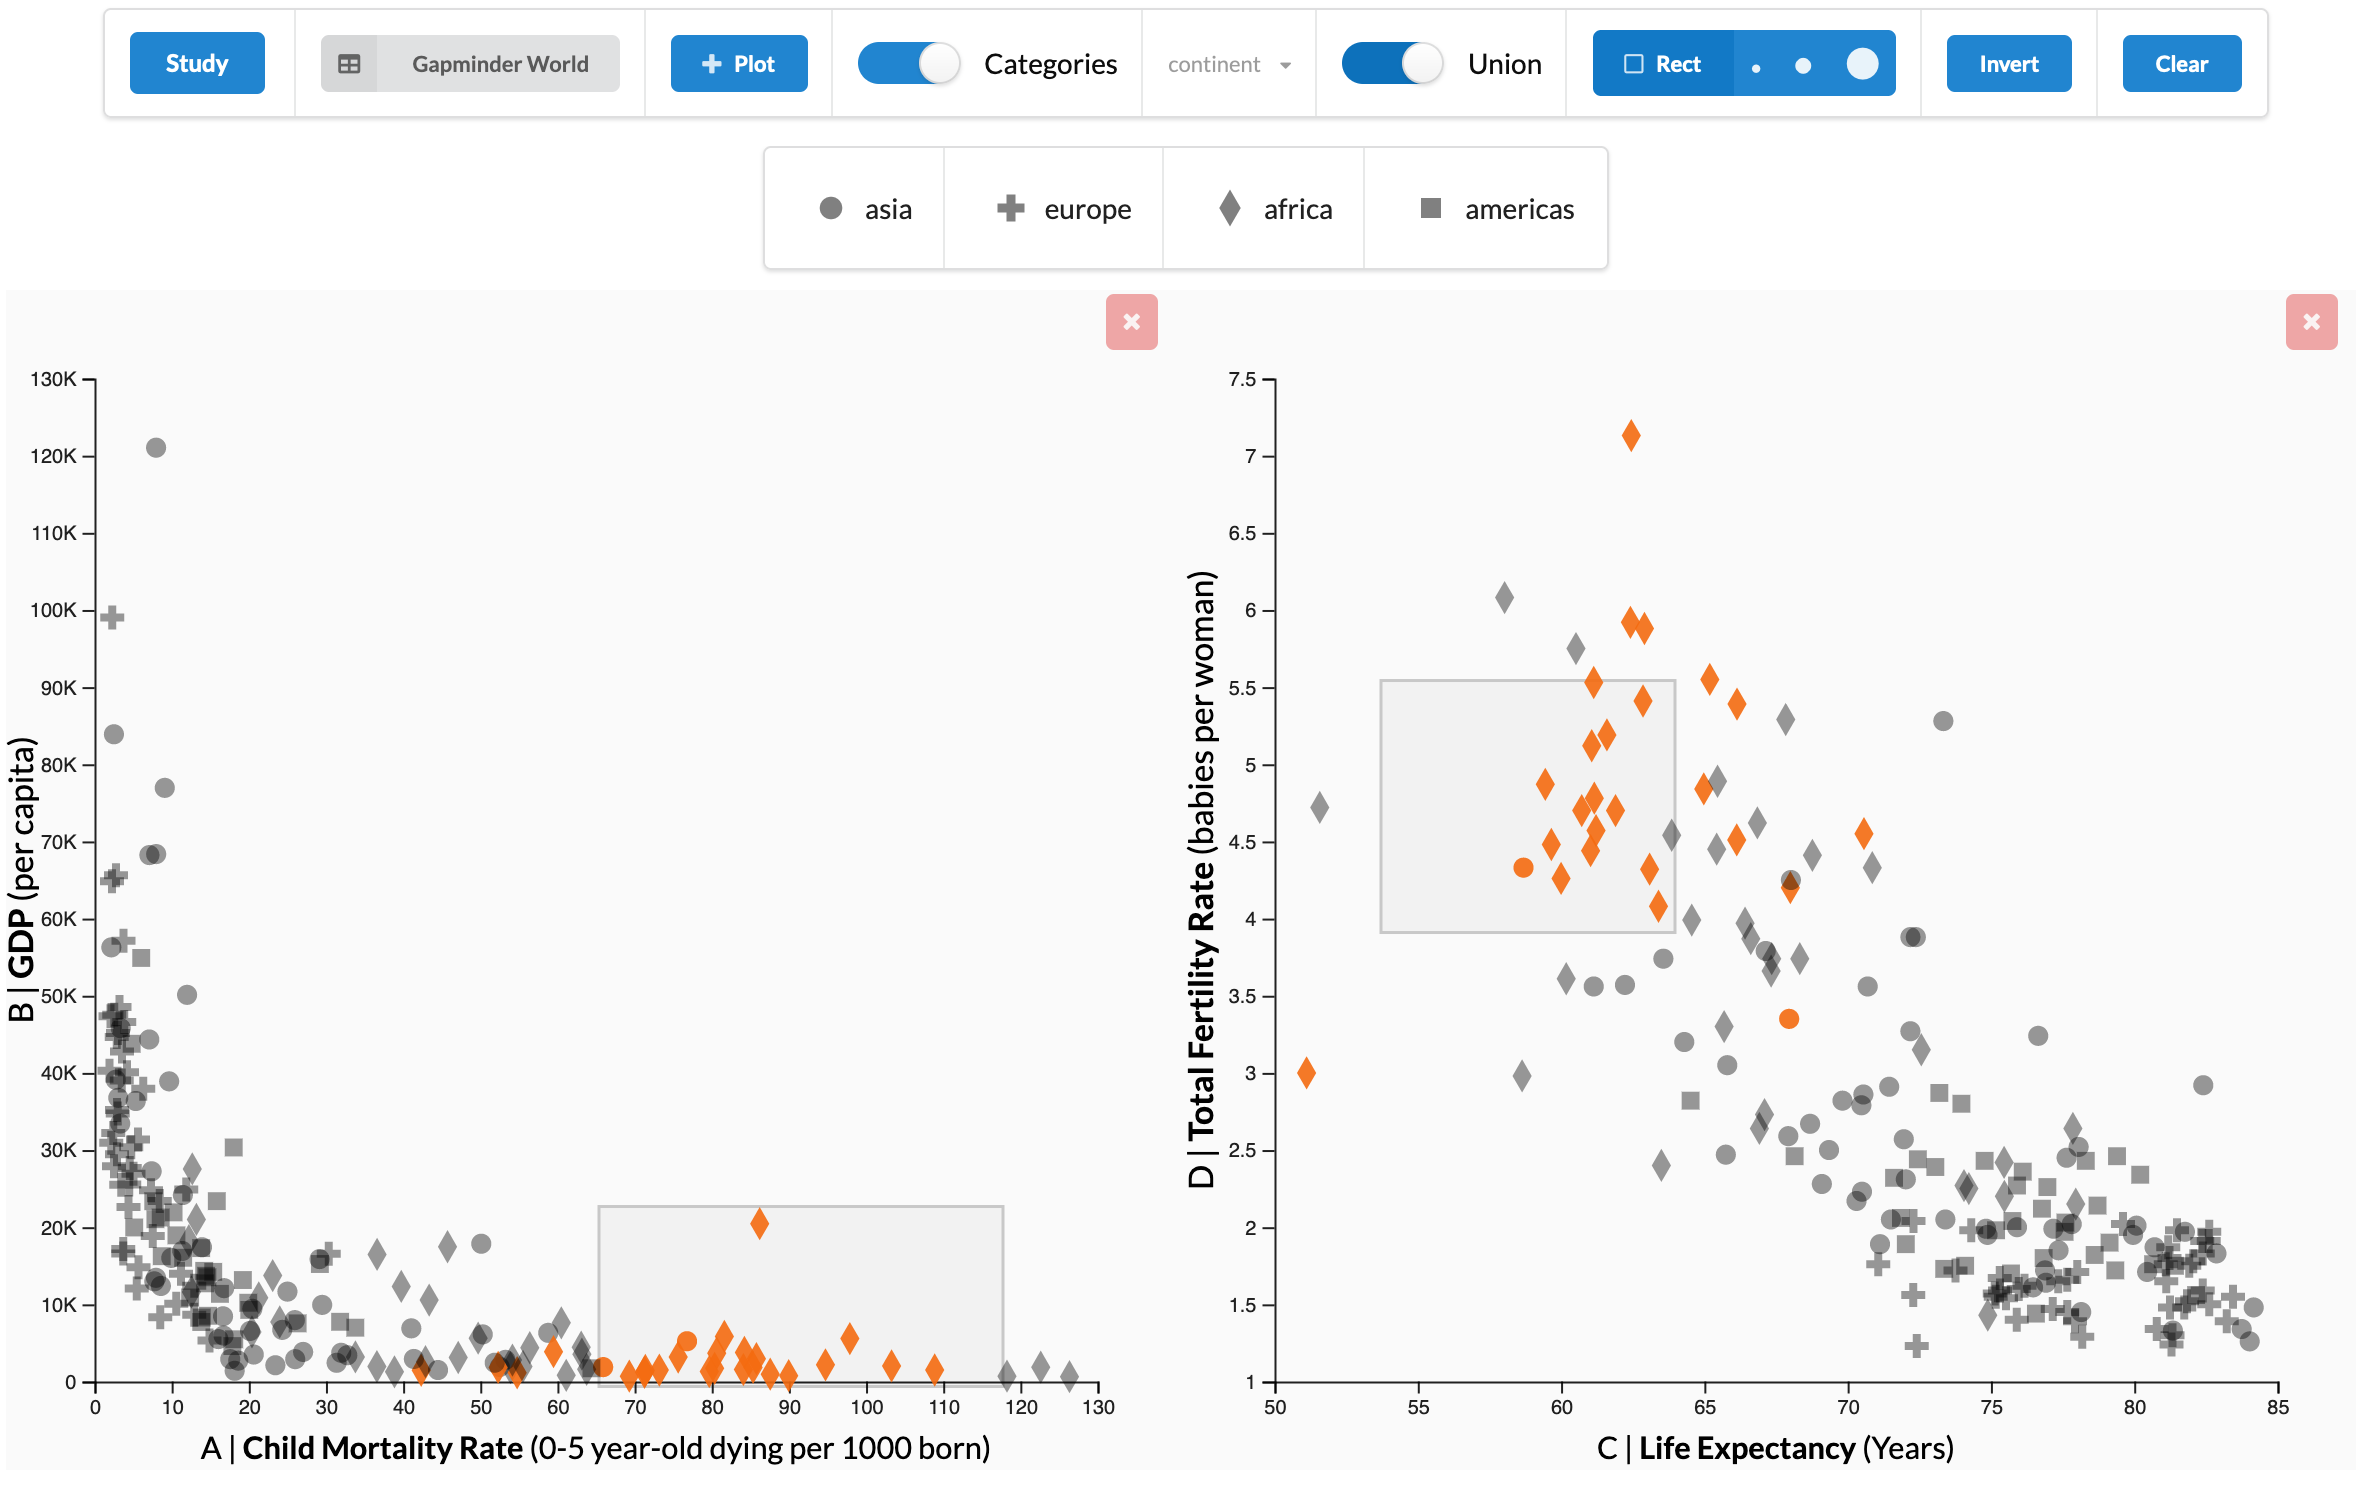
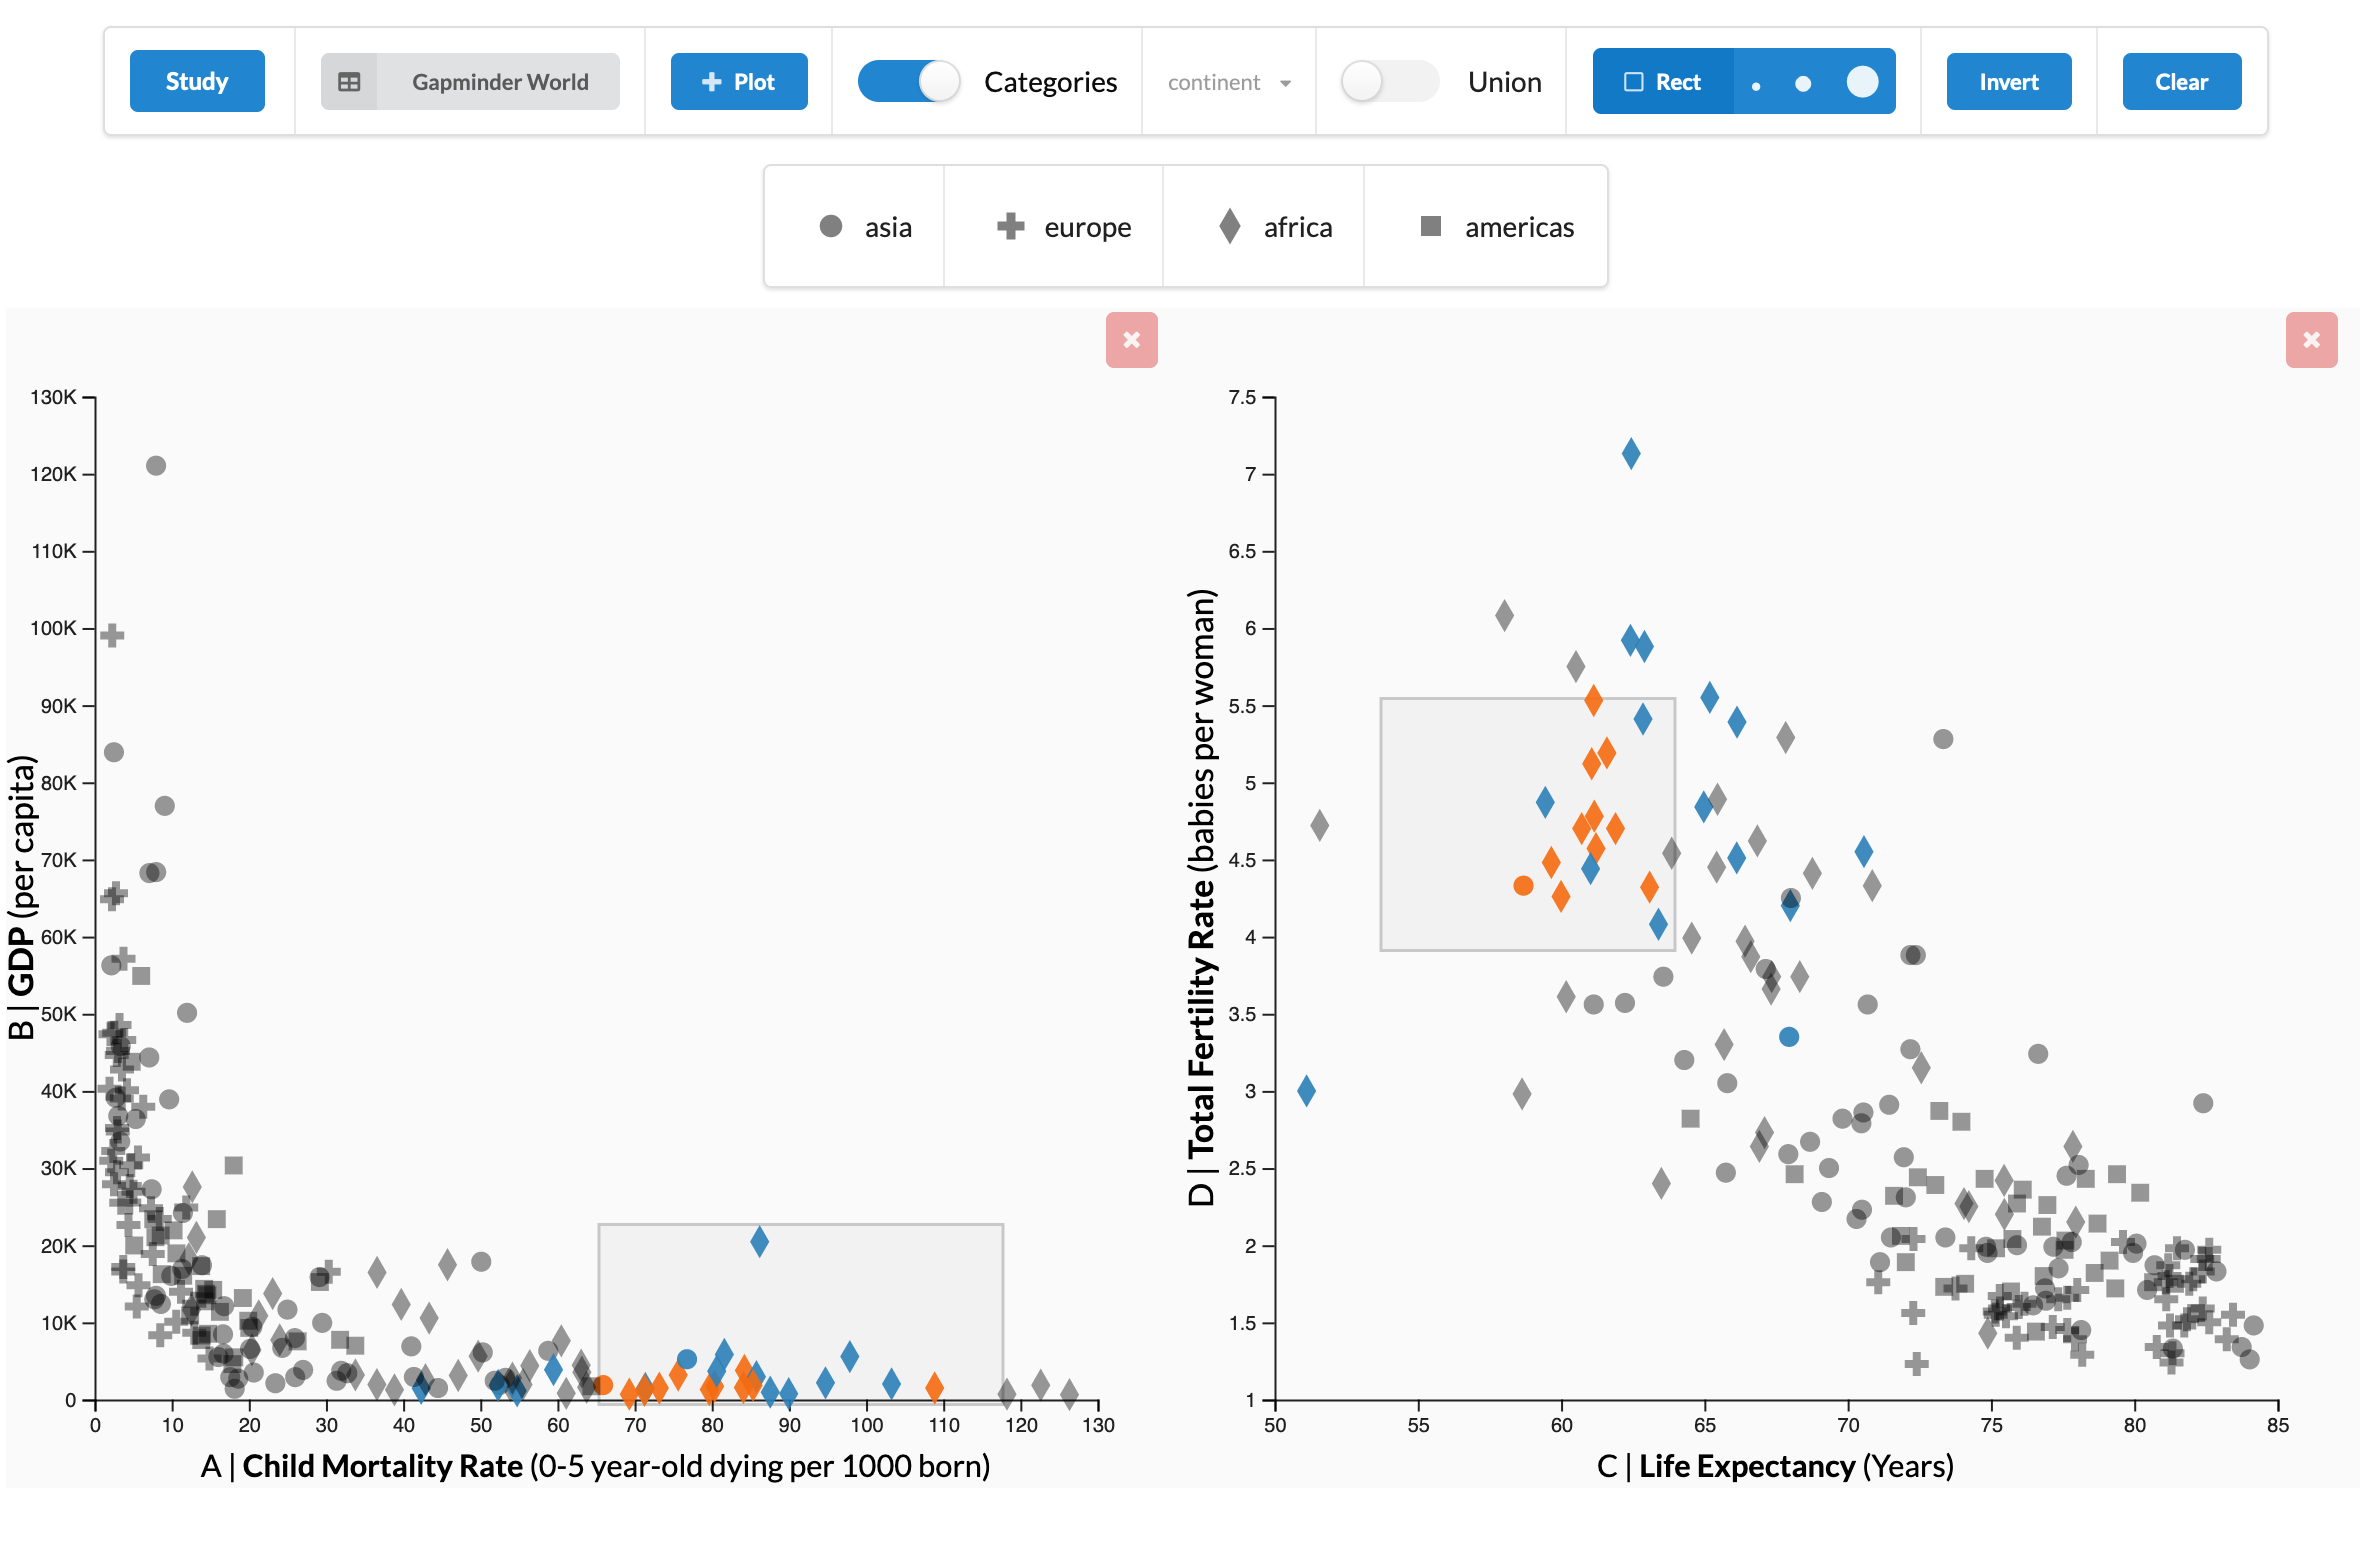
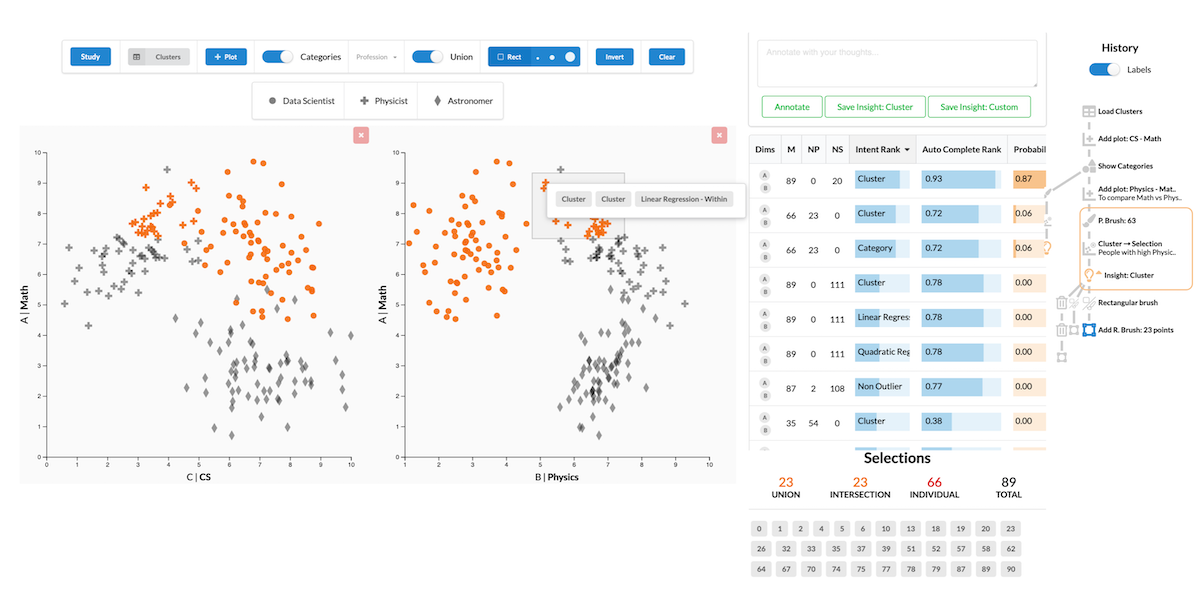
Predicting and capturing an analyst’s intent behind a selection in a data visualization is valuable in two scenarios: First, a successful prediction of a pattern an analyst intended to select can be used to auto-complete a partial selection which, in turn, can improve the correctness of the selection. Second, knowing the intent behind a selection can be used to improve recall and reproducibility. In this paper, we introduce methods to infer analyst's intents behind selections in data visualizations, such as scatterplots. We describe intents based on patterns in the data, and identify algorithms that can capture these patterns. Upon an interactive selection, we compare the selected items with the results of a large set of computed patterns, and use various ranking approaches to identify the best pattern for an analyst's selection. We store annotations and the metadata to reconstruct a selection, such as the type of algorithm and its parameterization, in a provenance graph. We present a prototype system that implements these methods for tabular data and scatterplots. Analysts can select a prediction to auto-complete partial selections and to seamlessly log their intents. We discuss implications of our approach for reproducibility and reuse of analysis workflows. We evaluate our approach in a crowd-sourced study, where we show that auto-completing selection improves accuracy, and that we can accurately capture pattern-based intent.
Citation
Kiran Gadhave,
Jochen Görtler,
Zach Cutler,
Carolina Nobre,
Oliver Deussen,
Miriah Meyer,
Jeff Phillips,
Alexander Lex
Predicting Intent Behind Selections in Scatterplot Visualizations
Information Visualization, 20(4): 207–228, doi:10.1177/14738716211038604, 2021.
BibTeX
@article{2021_ivi_intent,
  title = {Predicting Intent Behind Selections in Scatterplot Visualizations},
  author = {Kiran Gadhave and Jochen Görtler and Zach Cutler and Carolina Nobre and Oliver Deussen and Miriah Meyer and Jeff Phillips and Alexander Lex},
  journal = {Information Visualization},
  publisher = {SAGE},
  doi = {10.1177/14738716211038604},
  url = {https://doi.org/10.1177/14738716211038604},
  volume = {20},
  number = {4},
  pages = {207–228},
  month = {August},
  year = {2021}
}
Acknowledgements
We thank the domain experts we interviewed for their time and their willingness to provide datasets, and Lane Harrison and members of the Visualization Design Lab for feedback. We gratefully acknowledge funding by the National Science Foundation (IIS 1751238) and by the Deutsche Forschungsgemeinschaft (251654672-TRR 161).
Images
These images are not part of the original paper and licensed using CC BY 4.0. If you use these images, please cite the paper. Click on the images for full resolution.