Abstract
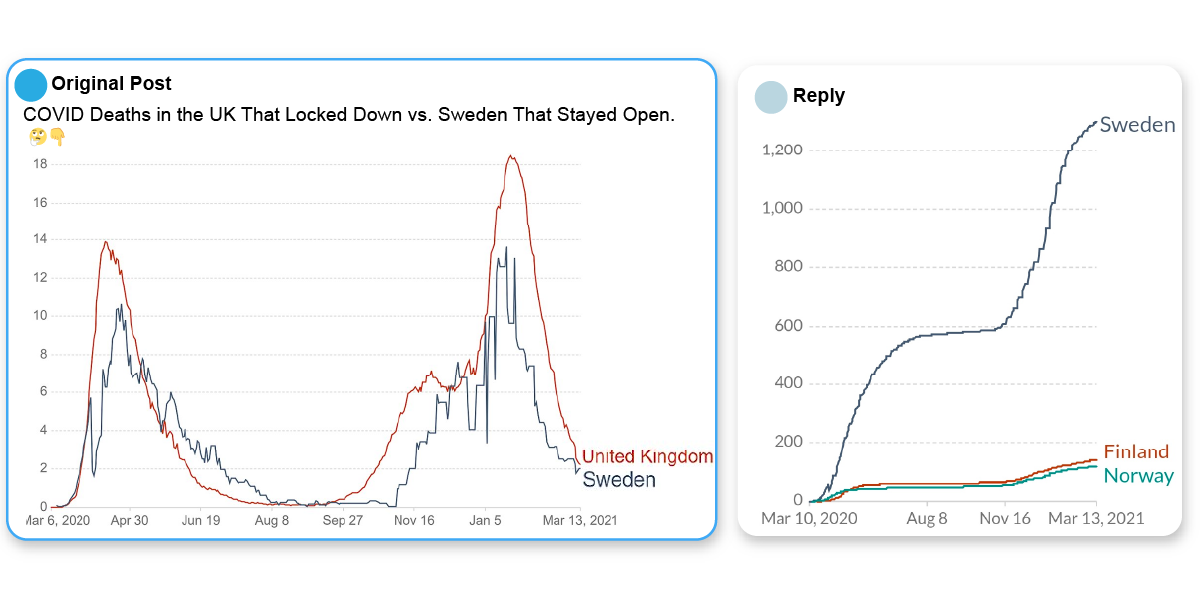
Attempting to make sense of a phenomenon or crisis, social media users often share data visualizations and interpretations that can be erroneous or misleading. Prior work has studied how data visualizations can mislead, but do misleading visualizations reach a broad social media audience? And if so, do users amplify or challenge misleading interpretations? To answer these questions, we conducted a mixed-methods analysis of the public's engagement with data visualization posts about COVID-19 on Twitter. Compared to posts with accurate visual insights, our results show that posts with misleading visualizations garner more replies in which the audiences point out nuanced fallacies and caveats in data interpretations. Based on the results of our thematic analysis of engagement, we identify and discuss important opportunities and limitations to effectively leveraging crowdsourced assessments to address data-driven misinformation.
Citation
Maxim Lisnic,
Alexander Lex,
Marina Kogan
‘Yeah, this graph doesn't show that’: Analysis of Online Engagement with Misleading Data Visualizations
SIGCHI Conference on Human Factors in Computing Systems (CHI), 1-14, doi:10.1145/3613904.3642448, 2024.
BibTeX
@inproceedings{2024_chi_yeah,
  title = {‘Yeah, this graph doesn't show that’: Analysis of Online Engagement with Misleading Data Visualizations},
  author = {Maxim Lisnic and Alexander Lex and Marina Kogan},
  booktitle = {SIGCHI Conference on Human Factors in Computing Systems (CHI)},
  publisher = {ACM},
  doi = {10.1145/3613904.3642448},
  pages = {1-14},
  year = {2024}
}
Acknowledgements
We wish to thank Cole Polychronis for his contributions. This work is supported by the National Science Foundation (IIS 2041136).