Abstract
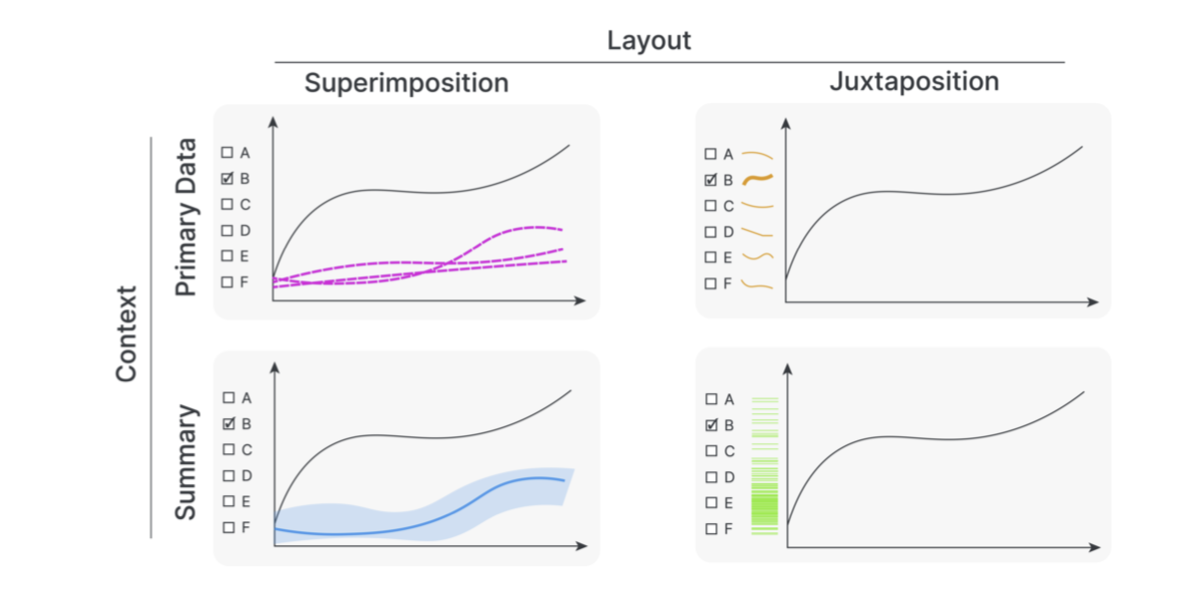
The growing popularity of interactive time series exploration platforms has made data visualization more accessible to the public. However, the ease of creating polished charts with preloaded data also enables selective information presentation, often resulting in biased or misleading visualizations. Research shows that these tools have been used to spread misinformation, particularly in areas such as public health and economic policies during the COVID-19 pandemic. Post hoc fact-checking may be ineffective because it typically addresses only a portion of misleading posts and comes too late to curb the spread. In this work, we explore using visualization design to counteract cherry-picking, a common tactic in deceptive visualizations. We propose a design space of guardrails—interventions to expose cherry-picking in time-series explorers. Through three crowd-sourced experiments, we demonstrate that guardrails, particularly those superimposing data, can encourage skepticism, though with some limitations. We provide recommendations for developing more effective visualization guardrails.
Citation
Maxim Lisnic,
Zach Cutler,
Marina Kogan,
Alexander Lex
Visualization Guardrails: Designing Interventions Against Cherry-Picking in Interactive Data Explorers
SIGCHI Conference on Human Factors in Computing Systems (CHI), 1-19, doi:10.1145/3706598.3713385, 2025.
BibTeX
@inproceedings{2025_chi_guardrails,
  title = {Visualization Guardrails: Designing Interventions Against Cherry-Picking in Interactive Data Explorers},
  author = {Maxim Lisnic and Zach Cutler and Marina Kogan and Alexander Lex},
  booktitle = {SIGCHI Conference on Human Factors in Computing Systems (CHI)},
  publisher = {ACM},
  doi = {10.1145/3706598.3713385},
  pages = {1-19},
  year = {2025}
}
Acknowledgements
This work is supported by the National Science Foundation (IIS 2041136, IIS 1751238, and CNS 2213756).