Element View Sidebar
The element view sidebar allows for intersection-wise and attribute-wise interactive analysis of dataset elements.
Components
The sidebar header contains 2 extra icons (in addition to the default close and expand icons). The leftmost allows for adding new plots to the sidebar; see Adding Plots. The second from the left opens the element query interface just below the header; see Selections.
![]()
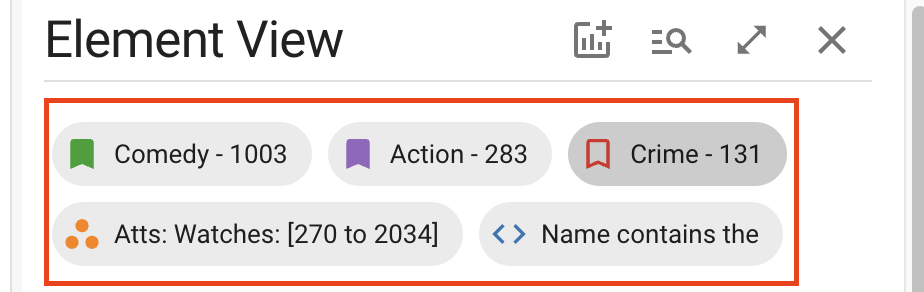
Below the header (and the element query interface, if open) are the bookmark & selection chips, which show selections and bookmarked intersections; see Selection Chips. If no selections or bookmarks exist, a blue notice will appear here instead.
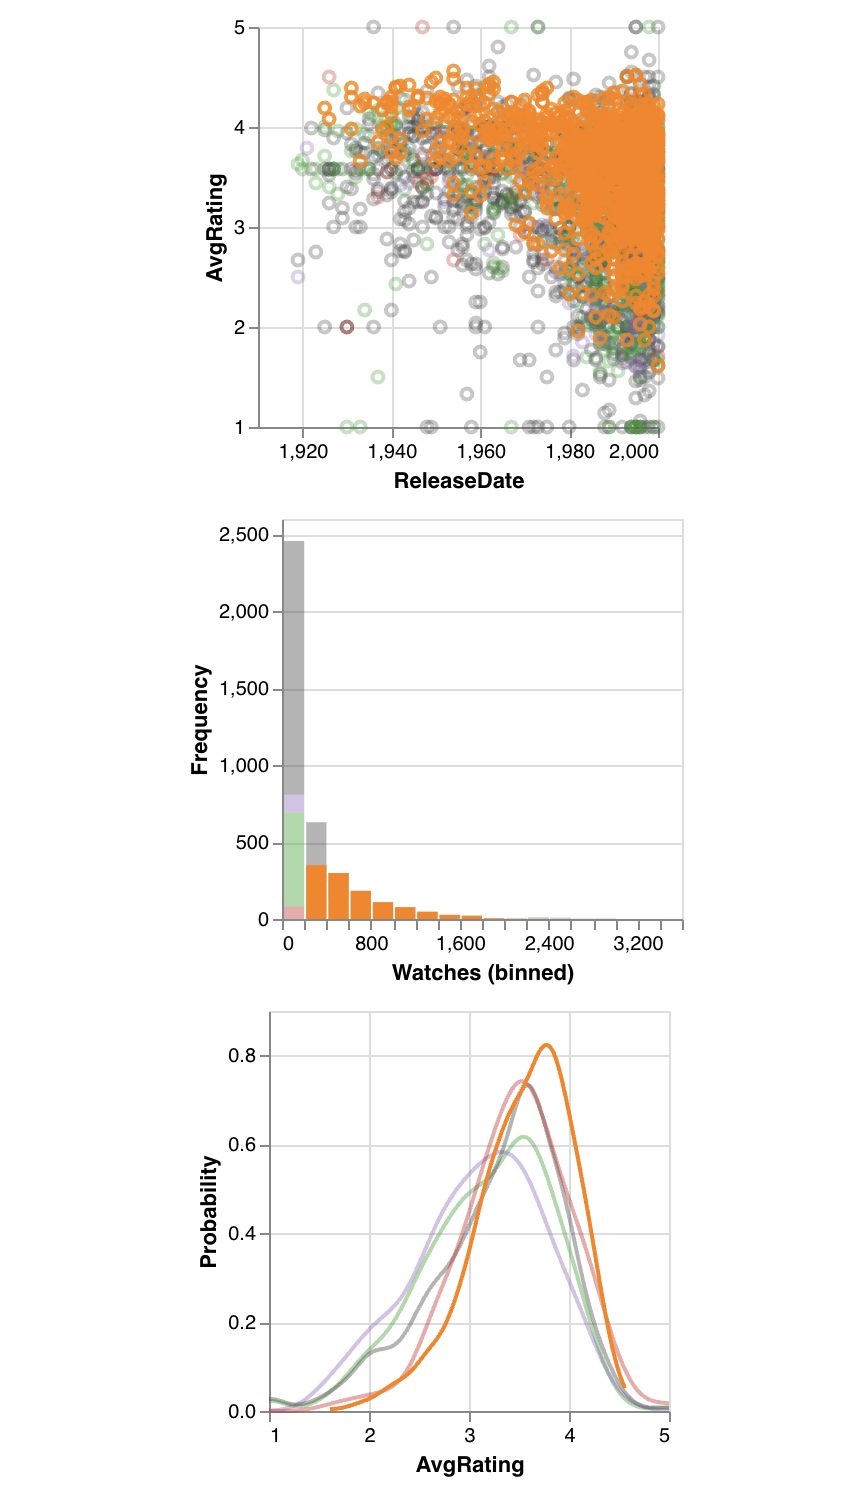
Below the selection chips are the plots, which also may be empty. By default, the plots consist of a histogram for each numeric attribute in the dataset. See Plots.
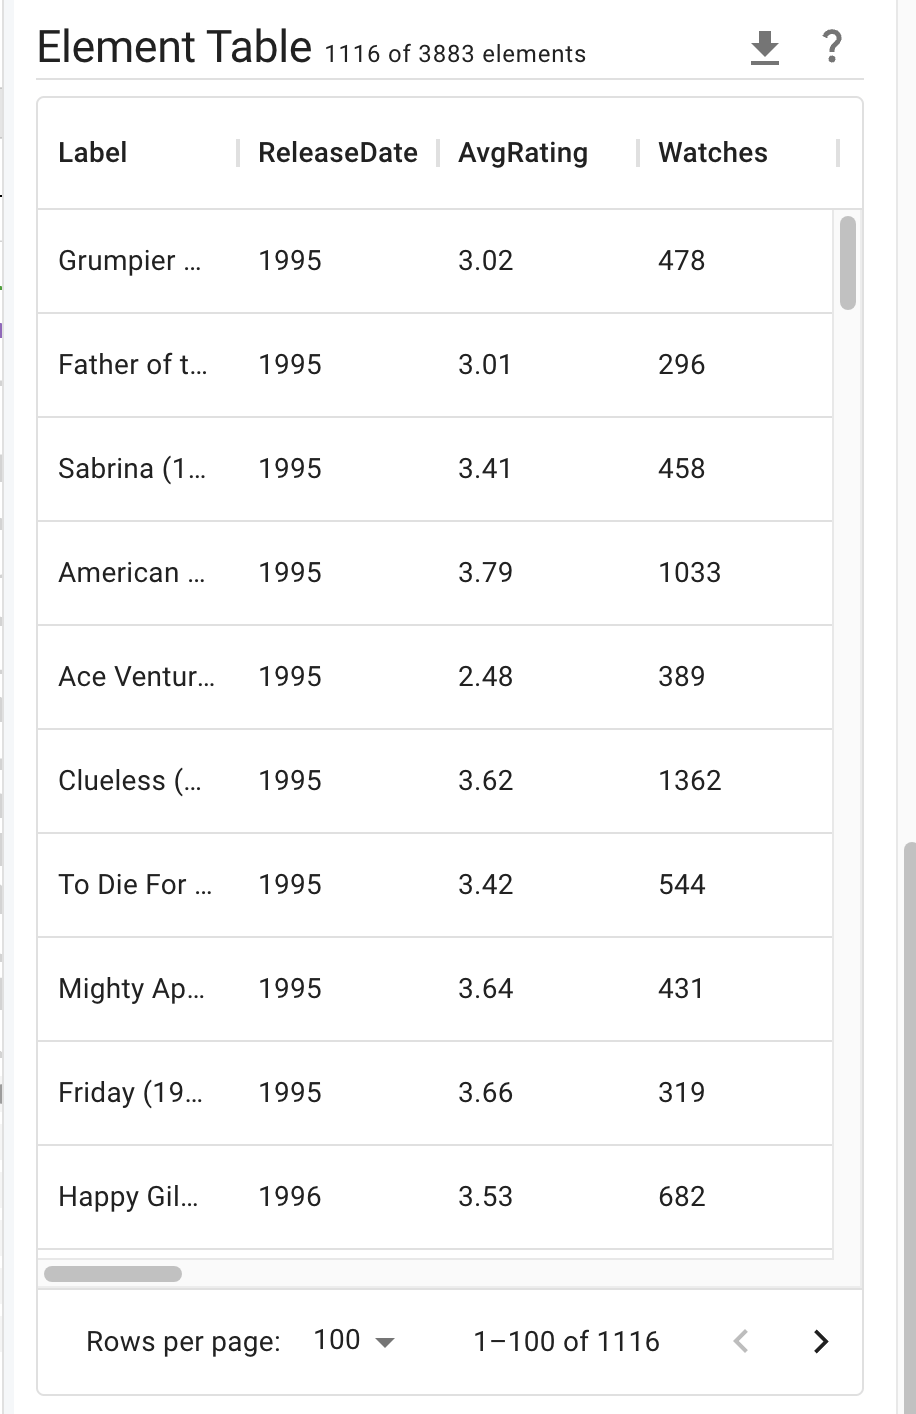
Below the plots is the element table, which shows either all elements or elements from the current selection if one is active; see Element Table.
🗃️ Plots
4 items
🗃️ Selections
3 items
📄️ Element Table
The element table appears at the bottom of the element view, displaying a list of all elements from the active selection and their attributes. For element queries and graphical selections, it shows all elements from visible intersections which fall within the bounds of the selection. For intersection selections, it shows all elements in the selected intersection. If no selection is active, all visible elements are shown.