Getting Started with Data Engagement Interviews
Gathering participants and analyst
We started our study by soliciting participation from our ongoing study participants1, and beginning our search for a data analyst2.
We made arrangements to interview each analyst candidate at a local coffee shop. The
interview involved on-the-spot analysis of sample datasets to answer a variety of test questions. Our analyst interview protocol gives more detail on the interview procedure, as well as the list of specific questions we had the analyst candidate worked through.
When evaluating our applicants, we were less focused on their ability to complete every
interview question, and more interested in their overall problem solving approach, personability, and ability to plot and process data under pressure. The analyst we selected came prepared to their interview with some exploratory analysis scripts already written, was able to clearly describe their overall analysis process, and take direction well.
Data wrangling and preparation
While signing up participants and interviewing analysts, we were also collecting and formatting participants’ data in preparation for our data engagement interviews3. Using some preprocessing scripts, we formatted participants’ raw air quality measurement data and event logs to be more amenable for real-time data analysis. This processing involved a variety of functions to assign additional metadata and categorical labels to participants’ air quality data. This formatting provided additional contextual information that helped us to filter and facet data within the interview.
Example: Processing raw ai quality data samples
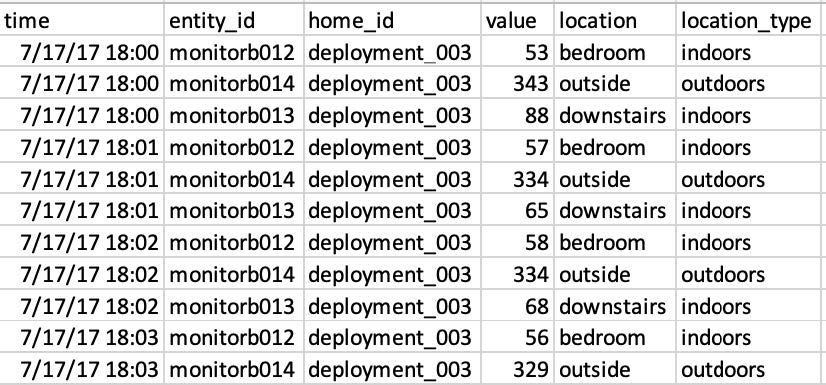
Fig. 1: Raw sensor data for participant P1 (deployment_003). Entity and home IDs are known only to researchers. The “value”, “location”, and “location_type” columns exist to give basic filtering for early troubleshooting.
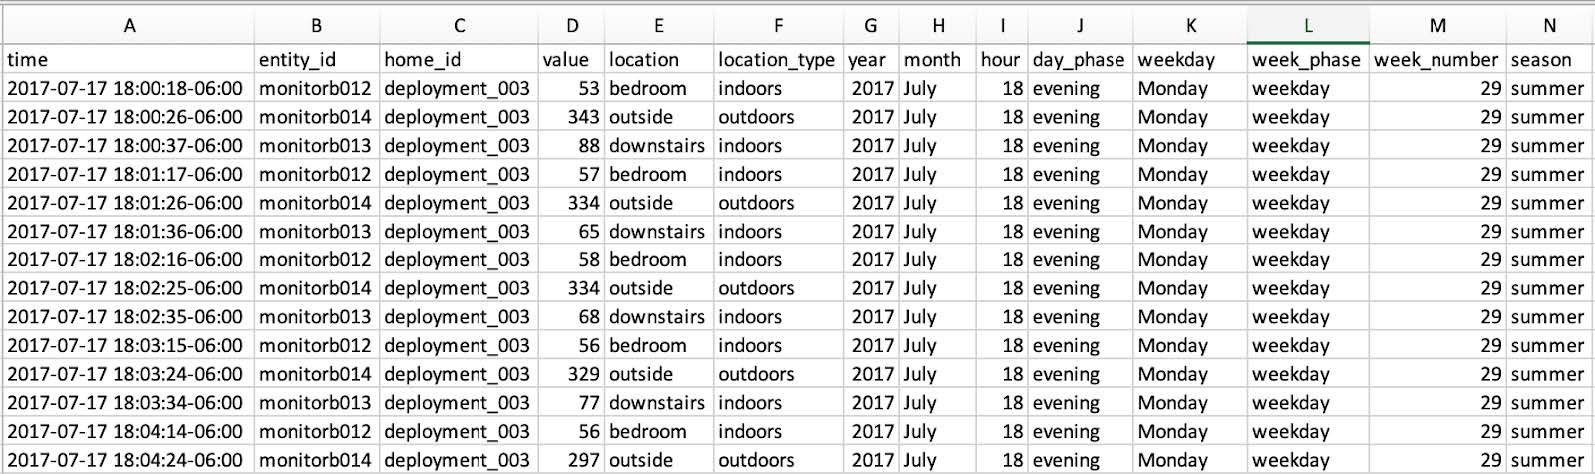
Fig. 2: Processed sensor data includes columns for: year, month, hour of day, phase of day (morning, afternoon, evening), day of week, phase of week (weekend, weekday), week number of participants deployment, and season.
Processing data for your own project
Processing raw data helps make it easier for the analyst to generate useful cuts, as well as to improve readability for the participant, who may have difficulty with interpreting data in its raw form. In our project, this meant converting UTC timestamps to local time, and unique sensor IDs to their specific locations in the participants’ home to improve data legibility.
You can take the same approach with your own data sources for generating similar categorical labels or derived metadata. This step can be tailored to support whatever analyses you imagine needing to perform. For example, if working with social media posts, these can be processed and coded according to user location, message topic, textual sentiment, or other salient dimensions that can support your research and analysis goals.
Analysis toolkit
We combined our prepared data with a collection of analysis scripts that our analyst developed over the course of his second round pilot interviews. Together, these allowed us to quickly process and analyze participants’ data.