How People Actually Lie With Charts

Online audiences and visualization researchers often share, discuss, and critique misleading visualizations. Existing critiques typically point out suboptimal choice of visual encoding or violations of common design guidelines. But is this how charts are used to deceive audiences and spread misinformation in practice? This blog post discusses the findings from our paper on misleading visualizations.
People seem to love critiquing visualization design and finding flaws in charts. When CNBC posted a chart with a bad visual encoding on Twitter, virtually every single one of the thousands of replies and quotes commented on nothing but the visualization design. Such critiques are not just limited to the comment section of the offending post—people seem to actively seek out and share bad charts along with their hot takes on how the chart is bad. For instance, thousands of users subscribe to a subreddit solely dedicated to ugly charts, news outlets cover egregious cases of chart crimes on TV, and data visualization researchers write papers and books about misleading charts and get together to discuss and poke fun at them.
Critiques of deceptive charts typically center on visual tricks: not-so-great design elements or choices, such as unnecessarily truncated axes, excessive embellishments, or 3-dimensional elements. And using a pie chart is considered an outright faux pas, regardless of any other visual tricks. But if misleading charts are so widely discussed and their flaws are pointed out by the masses, are they still misleading? And how common are misleading charts in practice? We set out to shed light on these questions by analyzing 10,000 Twitter posts with data visualizations about COVID-19.
How Common Are Misleading Visualizations and Visual Tricks?
In an attempt to evaluate whether a visualization is deceptive or not, we define misleading posts as ones that contain reasoning errors: unsupported assertions or logical fallacies as basis of the argument. Of all posts that offer an interpretation of COVID-19 visualizations (as opposed to those that just state facts), we find that 84% are misleading.
Importantly though, only 11% of such misleading visualization posts violate common visualization design guidelines—use truncated or dual axes, pie charts, and other commonly-cited “chart crimes” that people so eagerly spot. And less than 1% of charts were incorrectly interpreted by the tweet author because of visual tricks. In other words, merely 11% of our misleading charts would end up called out in a news article or on r/dataisugly, and almost none of them actually fooled anyone.
What Makes a Visualization Misleading?
Besides incorrectly reading a chart—something that less than 1% of tweet authors did—we define 6 other common types of reasoning errors among COVID-19 posts: cherry-picking, setting an arbitrary threshold, incorrectly inferring causality, issues caused by data validity, failing to account for statistical nuance, and misrepresenting scientific results. We discuss examples of each one below.
Cherry-Picking
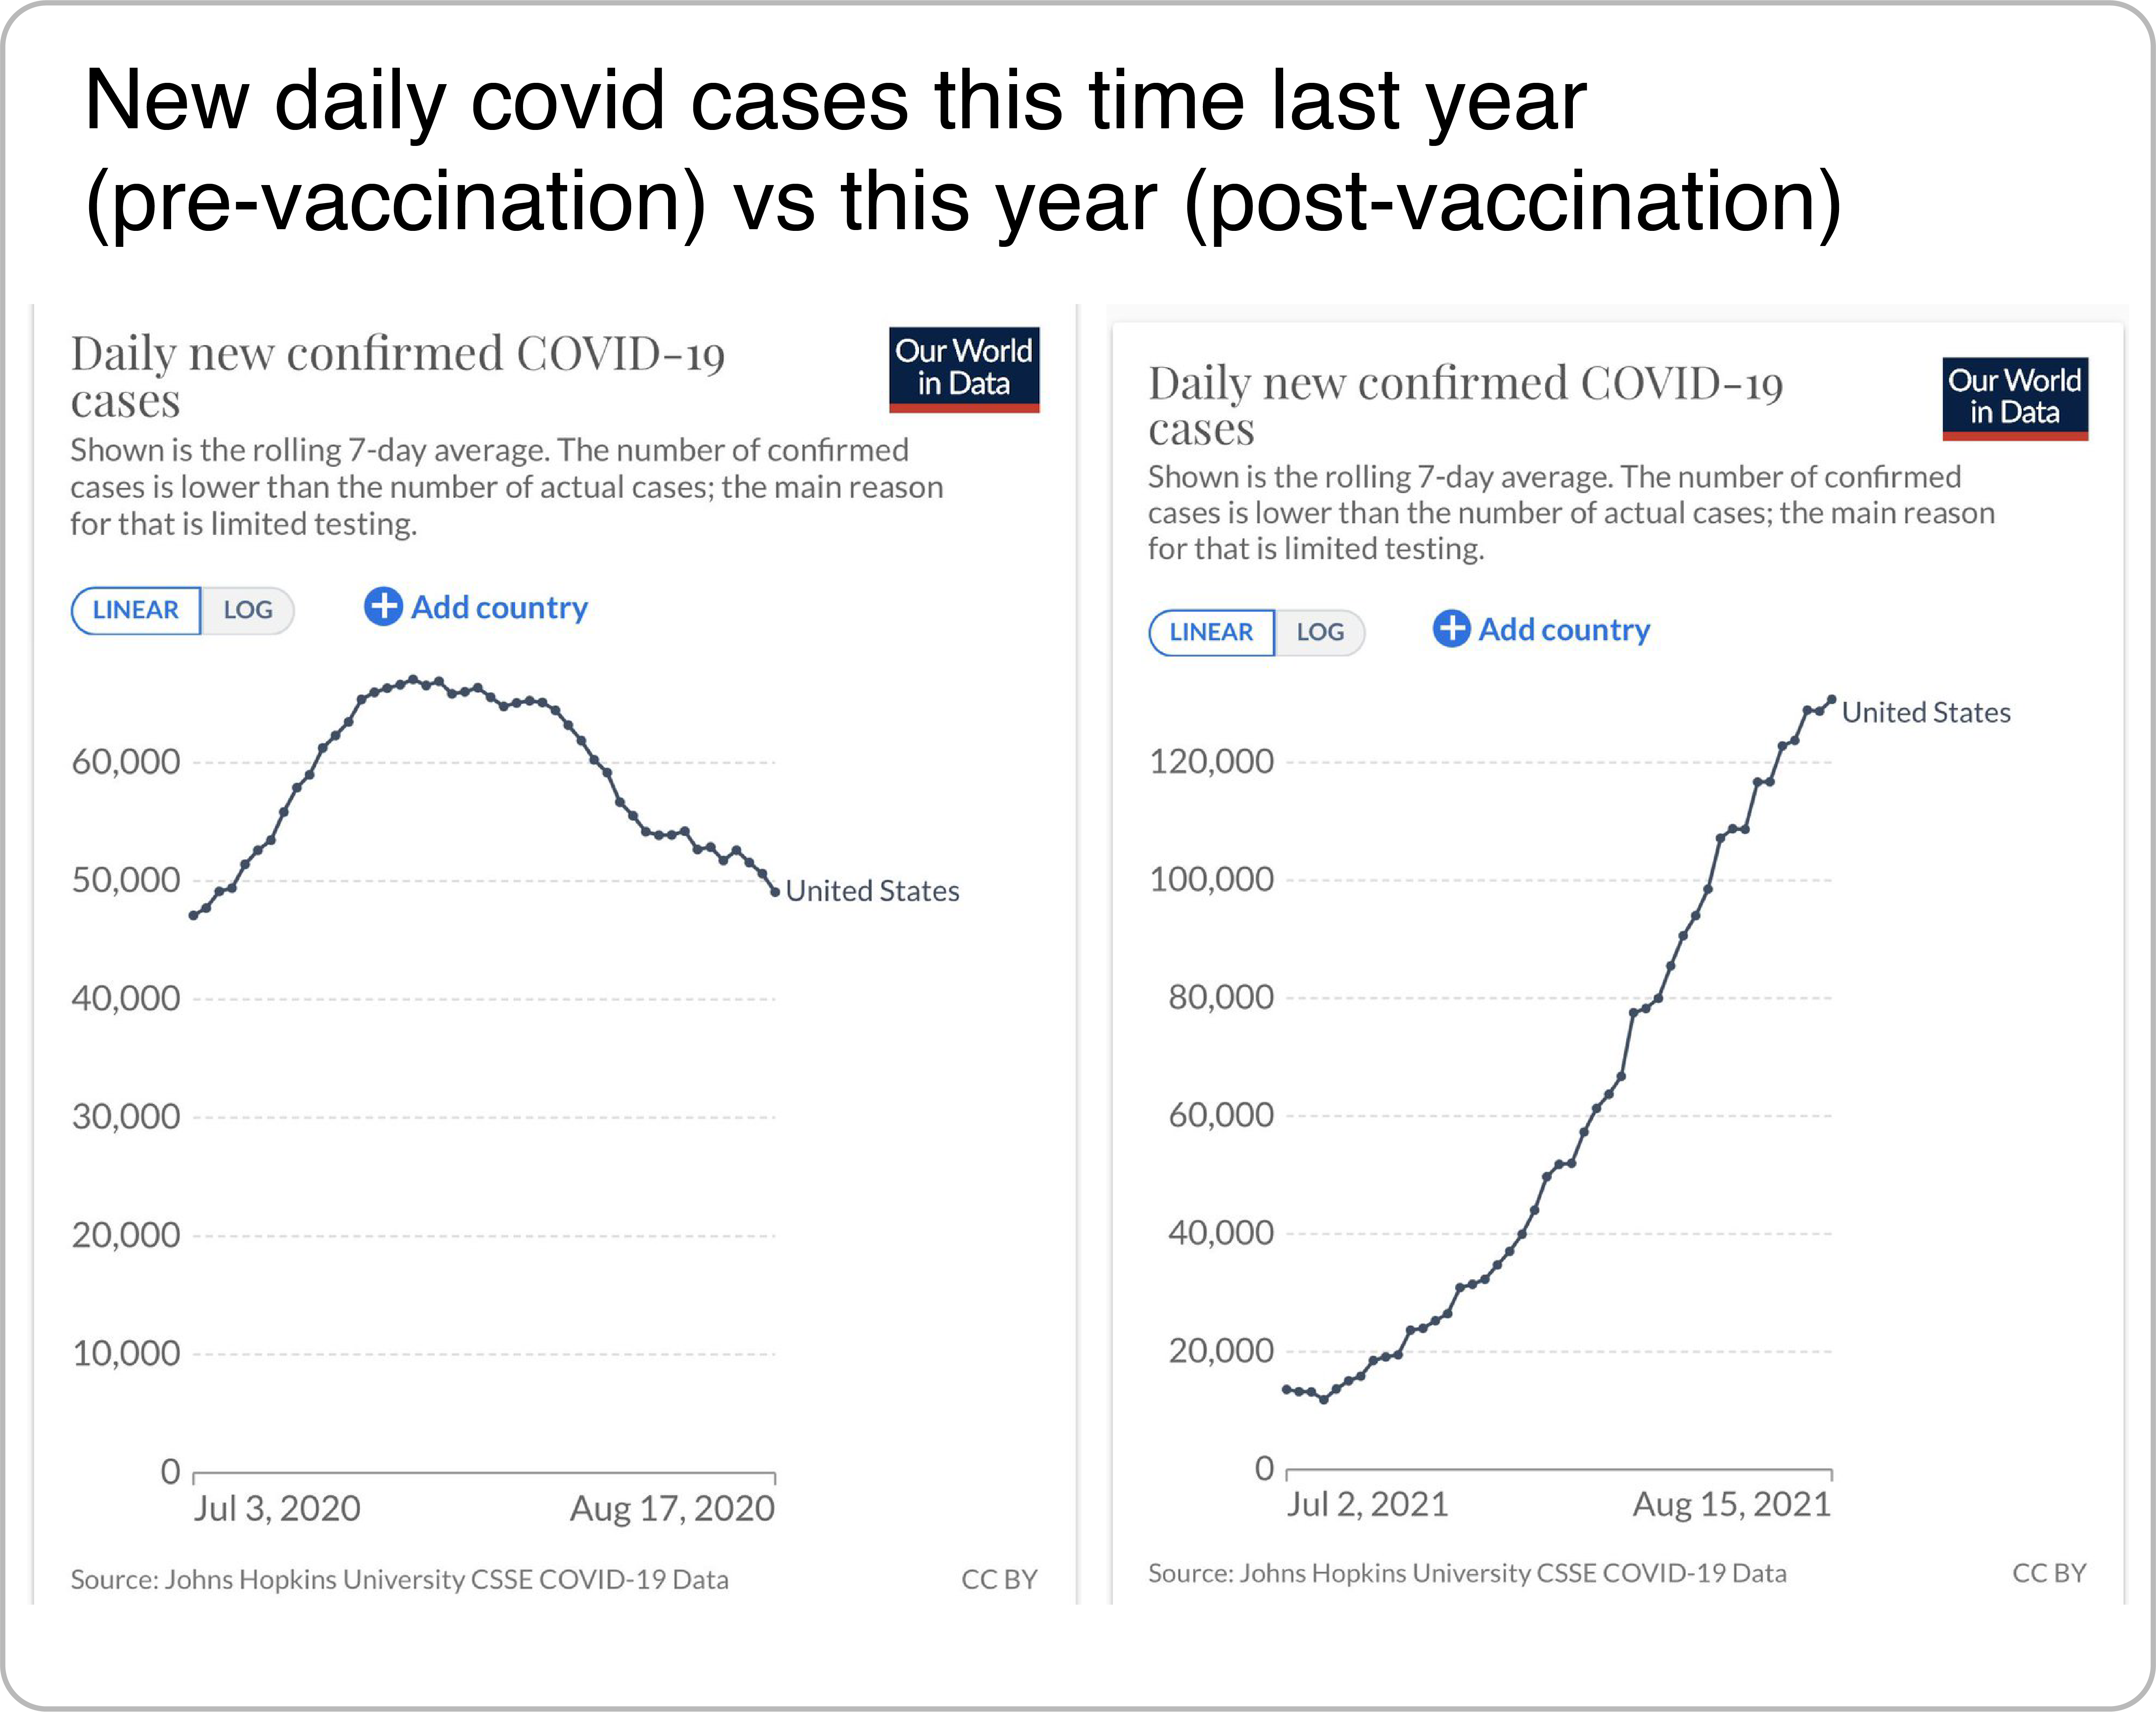
Visualization posts employ cherry-picking when the main conclusion is consistent with the incomplete evidence presented but likely would not be generalizable with more representative evidence. In the example shown below, a user shares COVID case curves for the US for the periods of early July through mid August for the years 2020 (before the vaccination campaign) and 2021 (during the vaccination campaign). Because the number of cases in August 2021 is higher than in August 2020, the user suggests that the vaccination campaign failed. Besides the fact that the implication is based on a single county, this example also carefully selects the time frame that most effectively supports the argument, omitting a large drop in cases in Spring 2021.
Setting an Arbitrary Threshold
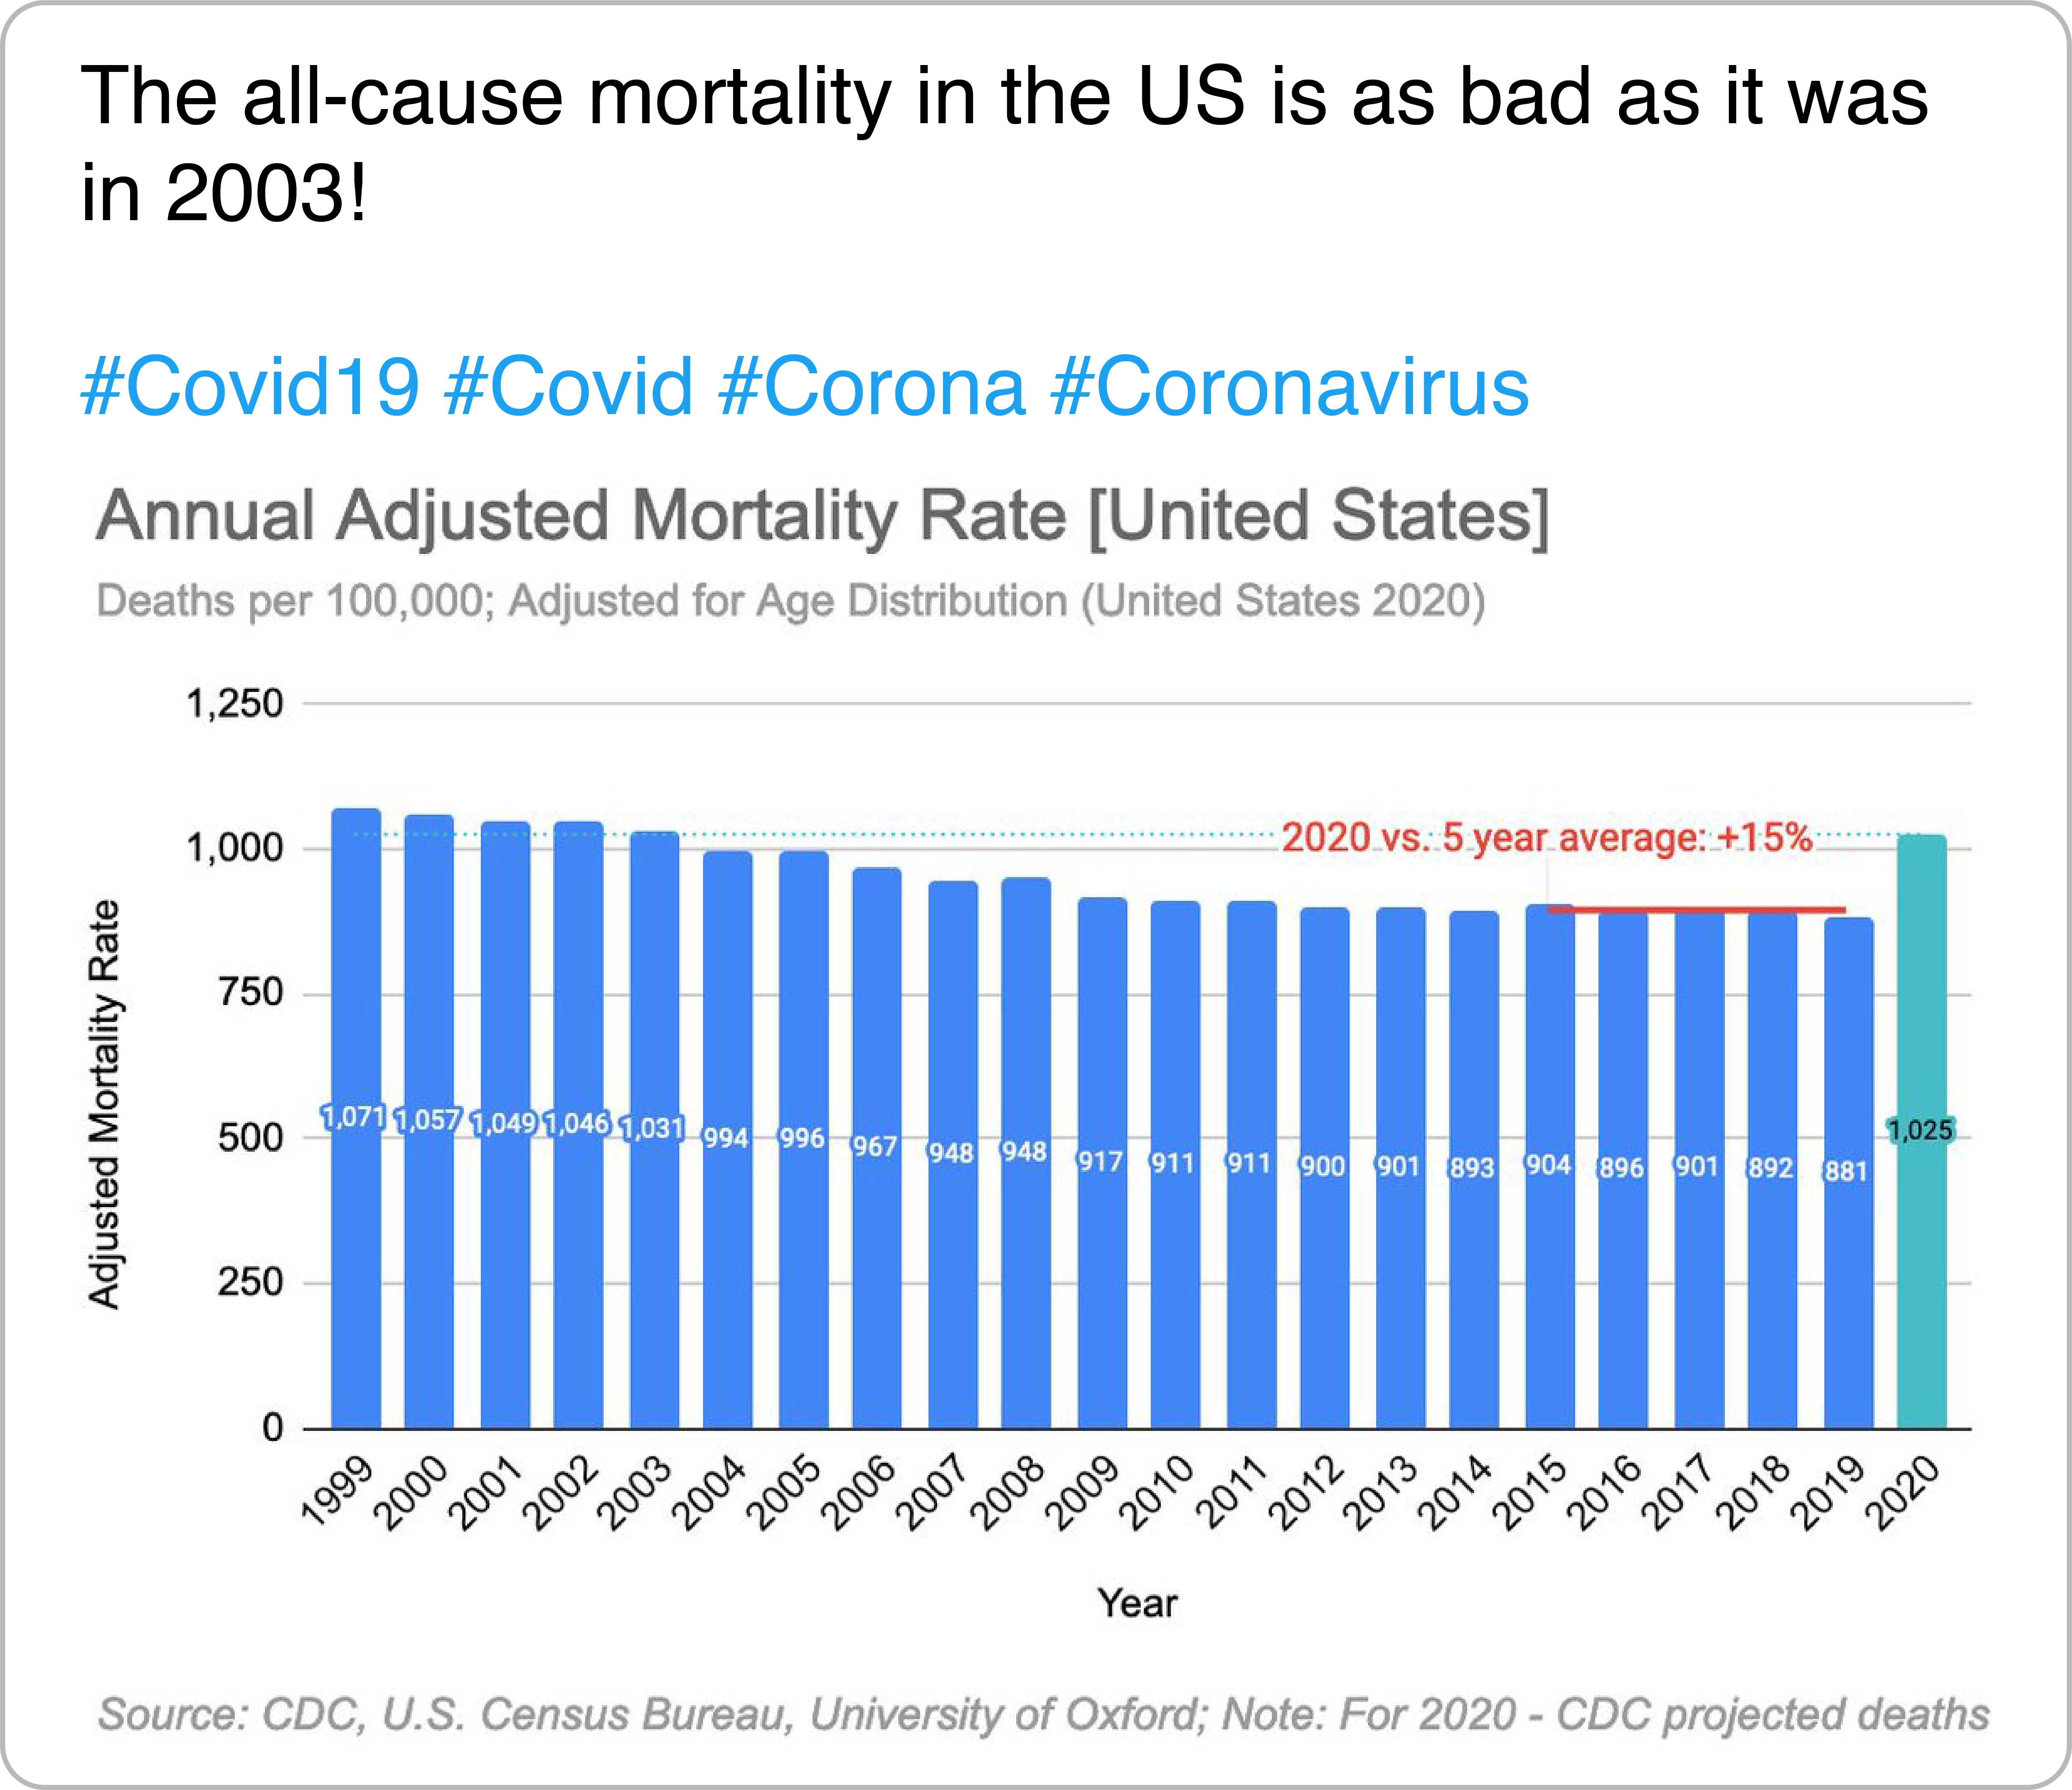
According to A Dictionary of Epidemiology, an epidemic is “an illness […] clearly in excess of normal expectancy.” What is defined to be “clearly in excess” or “normal expectancy” is to be determined holistically by public health and epidemiology experts, but this does not stop users from offering their own assessments online. In the example, an author shares a chart of the annual mortality rate in the US and argues that an increase in deaths of “only” 15% is not significant enough.
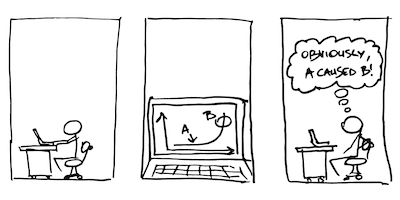
Causal Inference
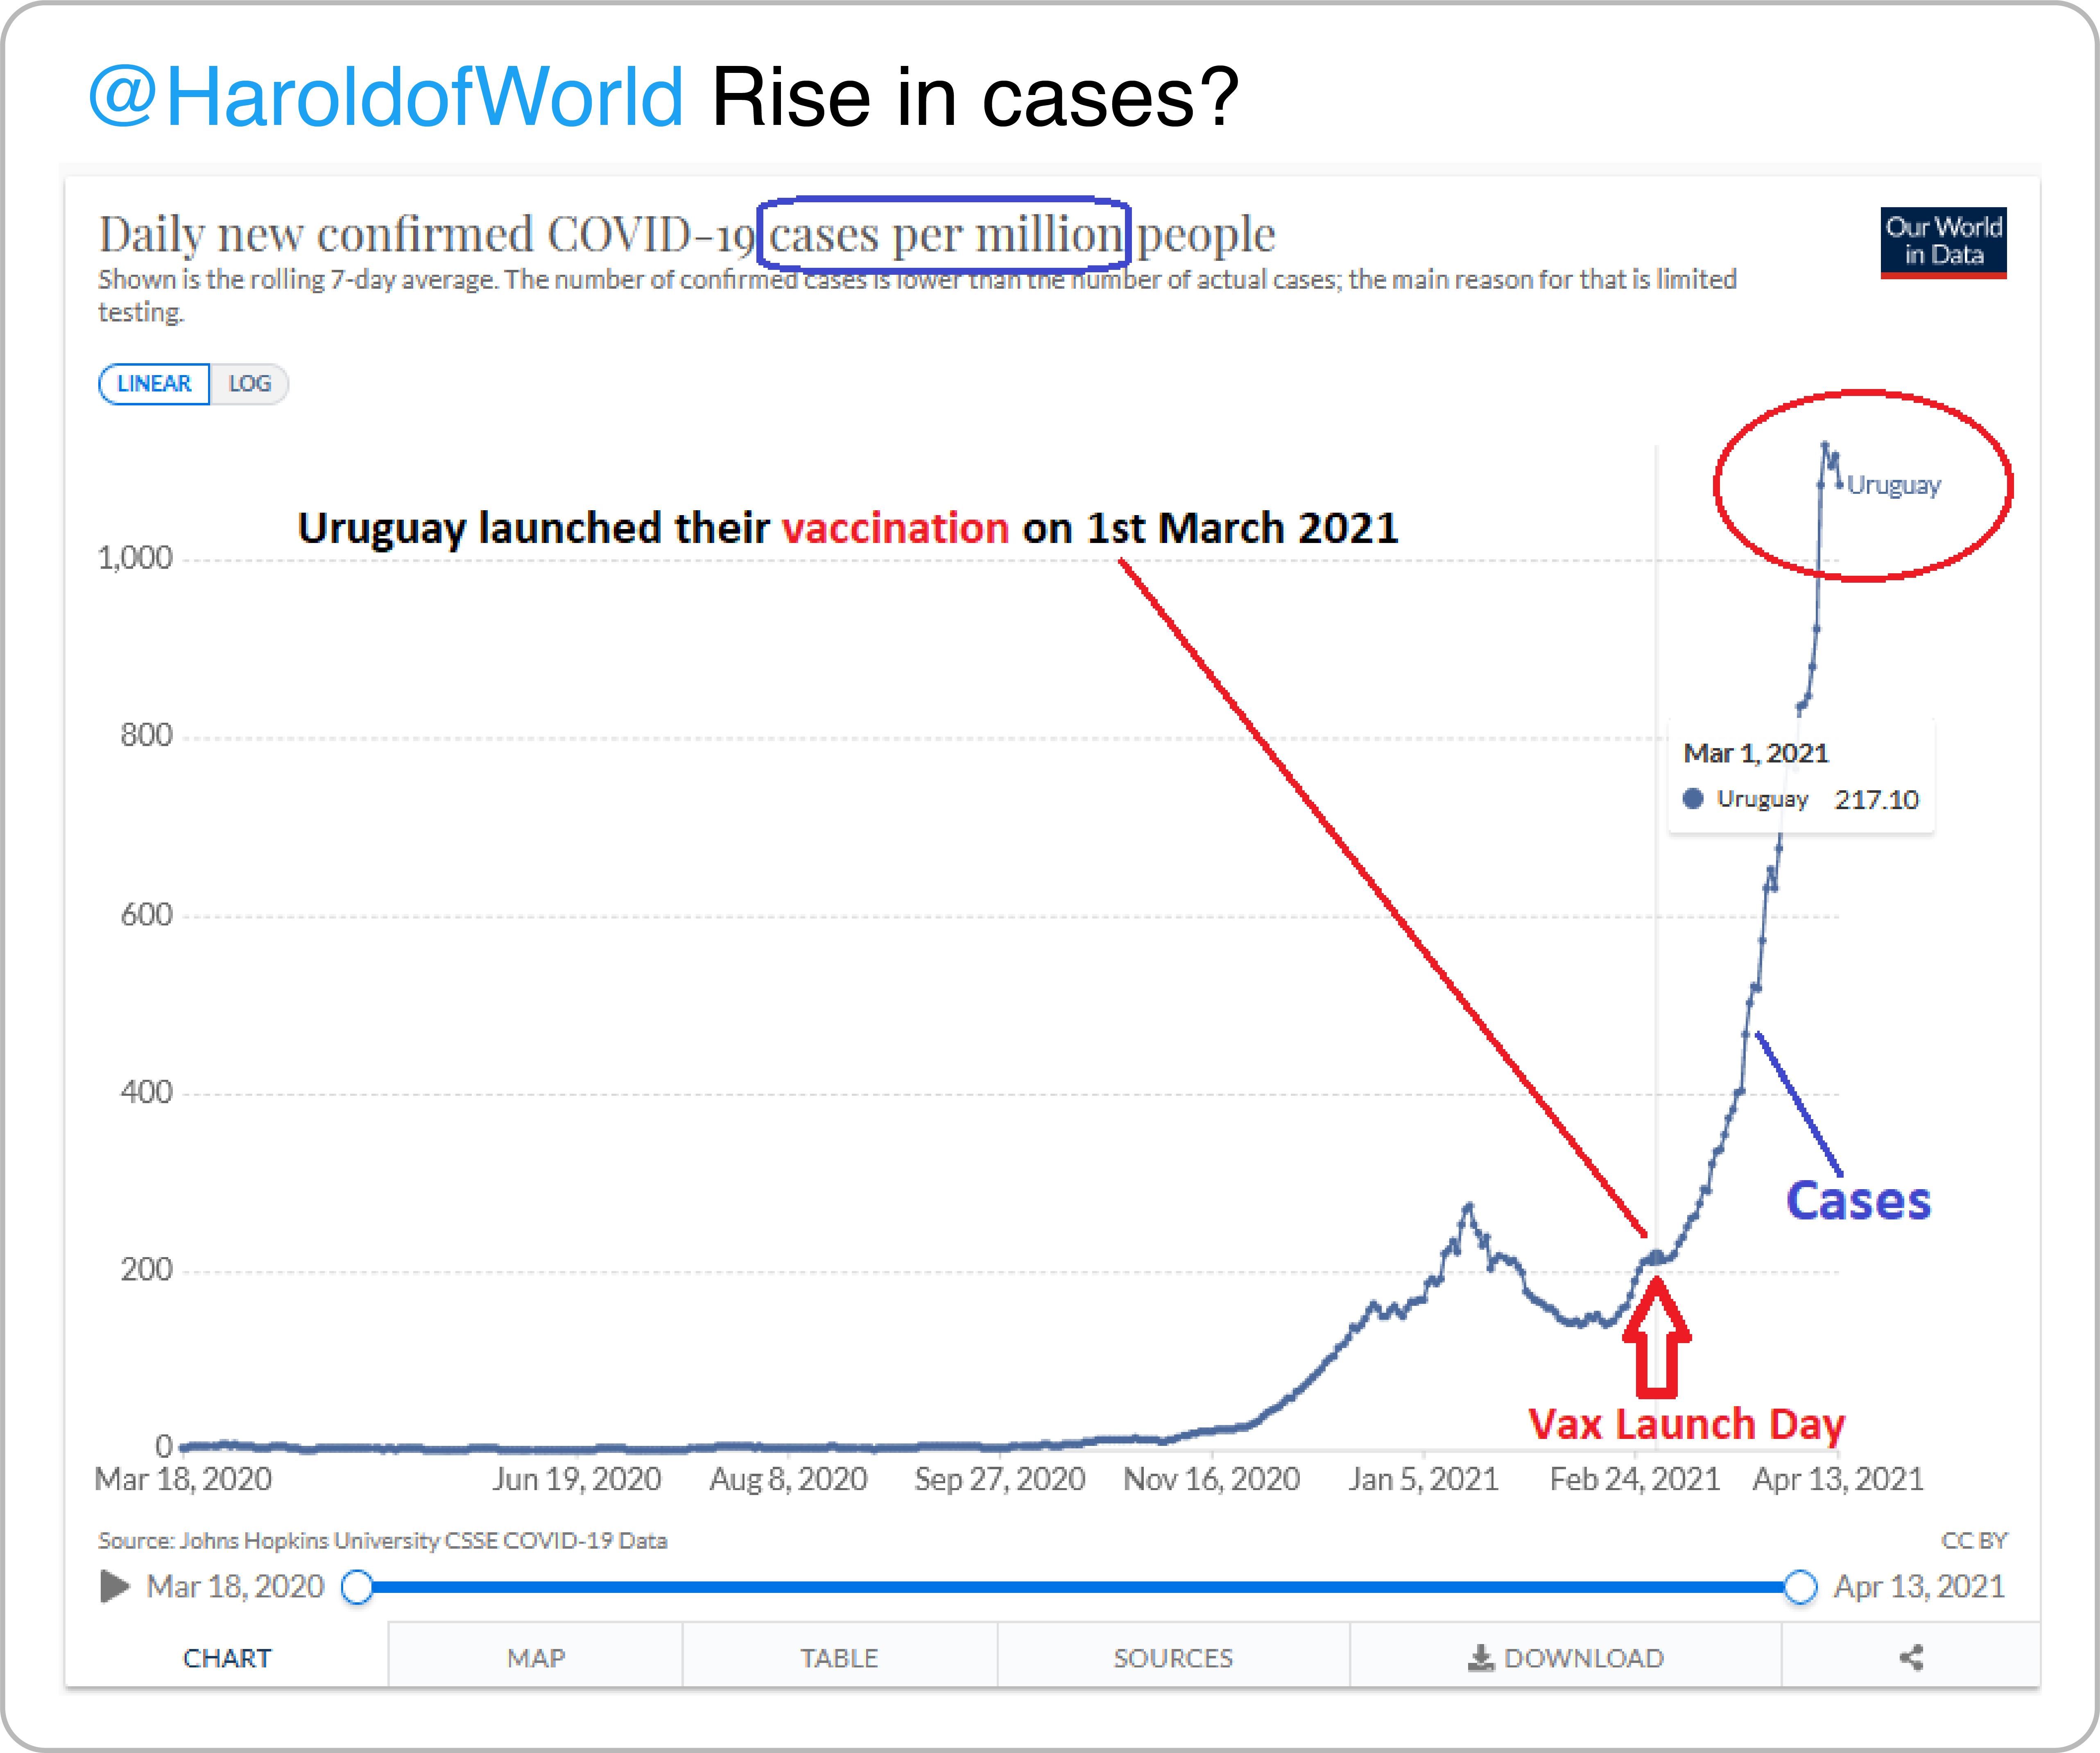
We often hear that correlation is not causation, yet we observe many authors assigning cause-and-effect relationships based solely on a chart. For instance, this tweet suggests that the sharp increase in COVID-19 cases in Uruguay—a prominent feature of the chart—was caused by the vaccination campaign and that vaccines are harmful.
Issues With Data Validity
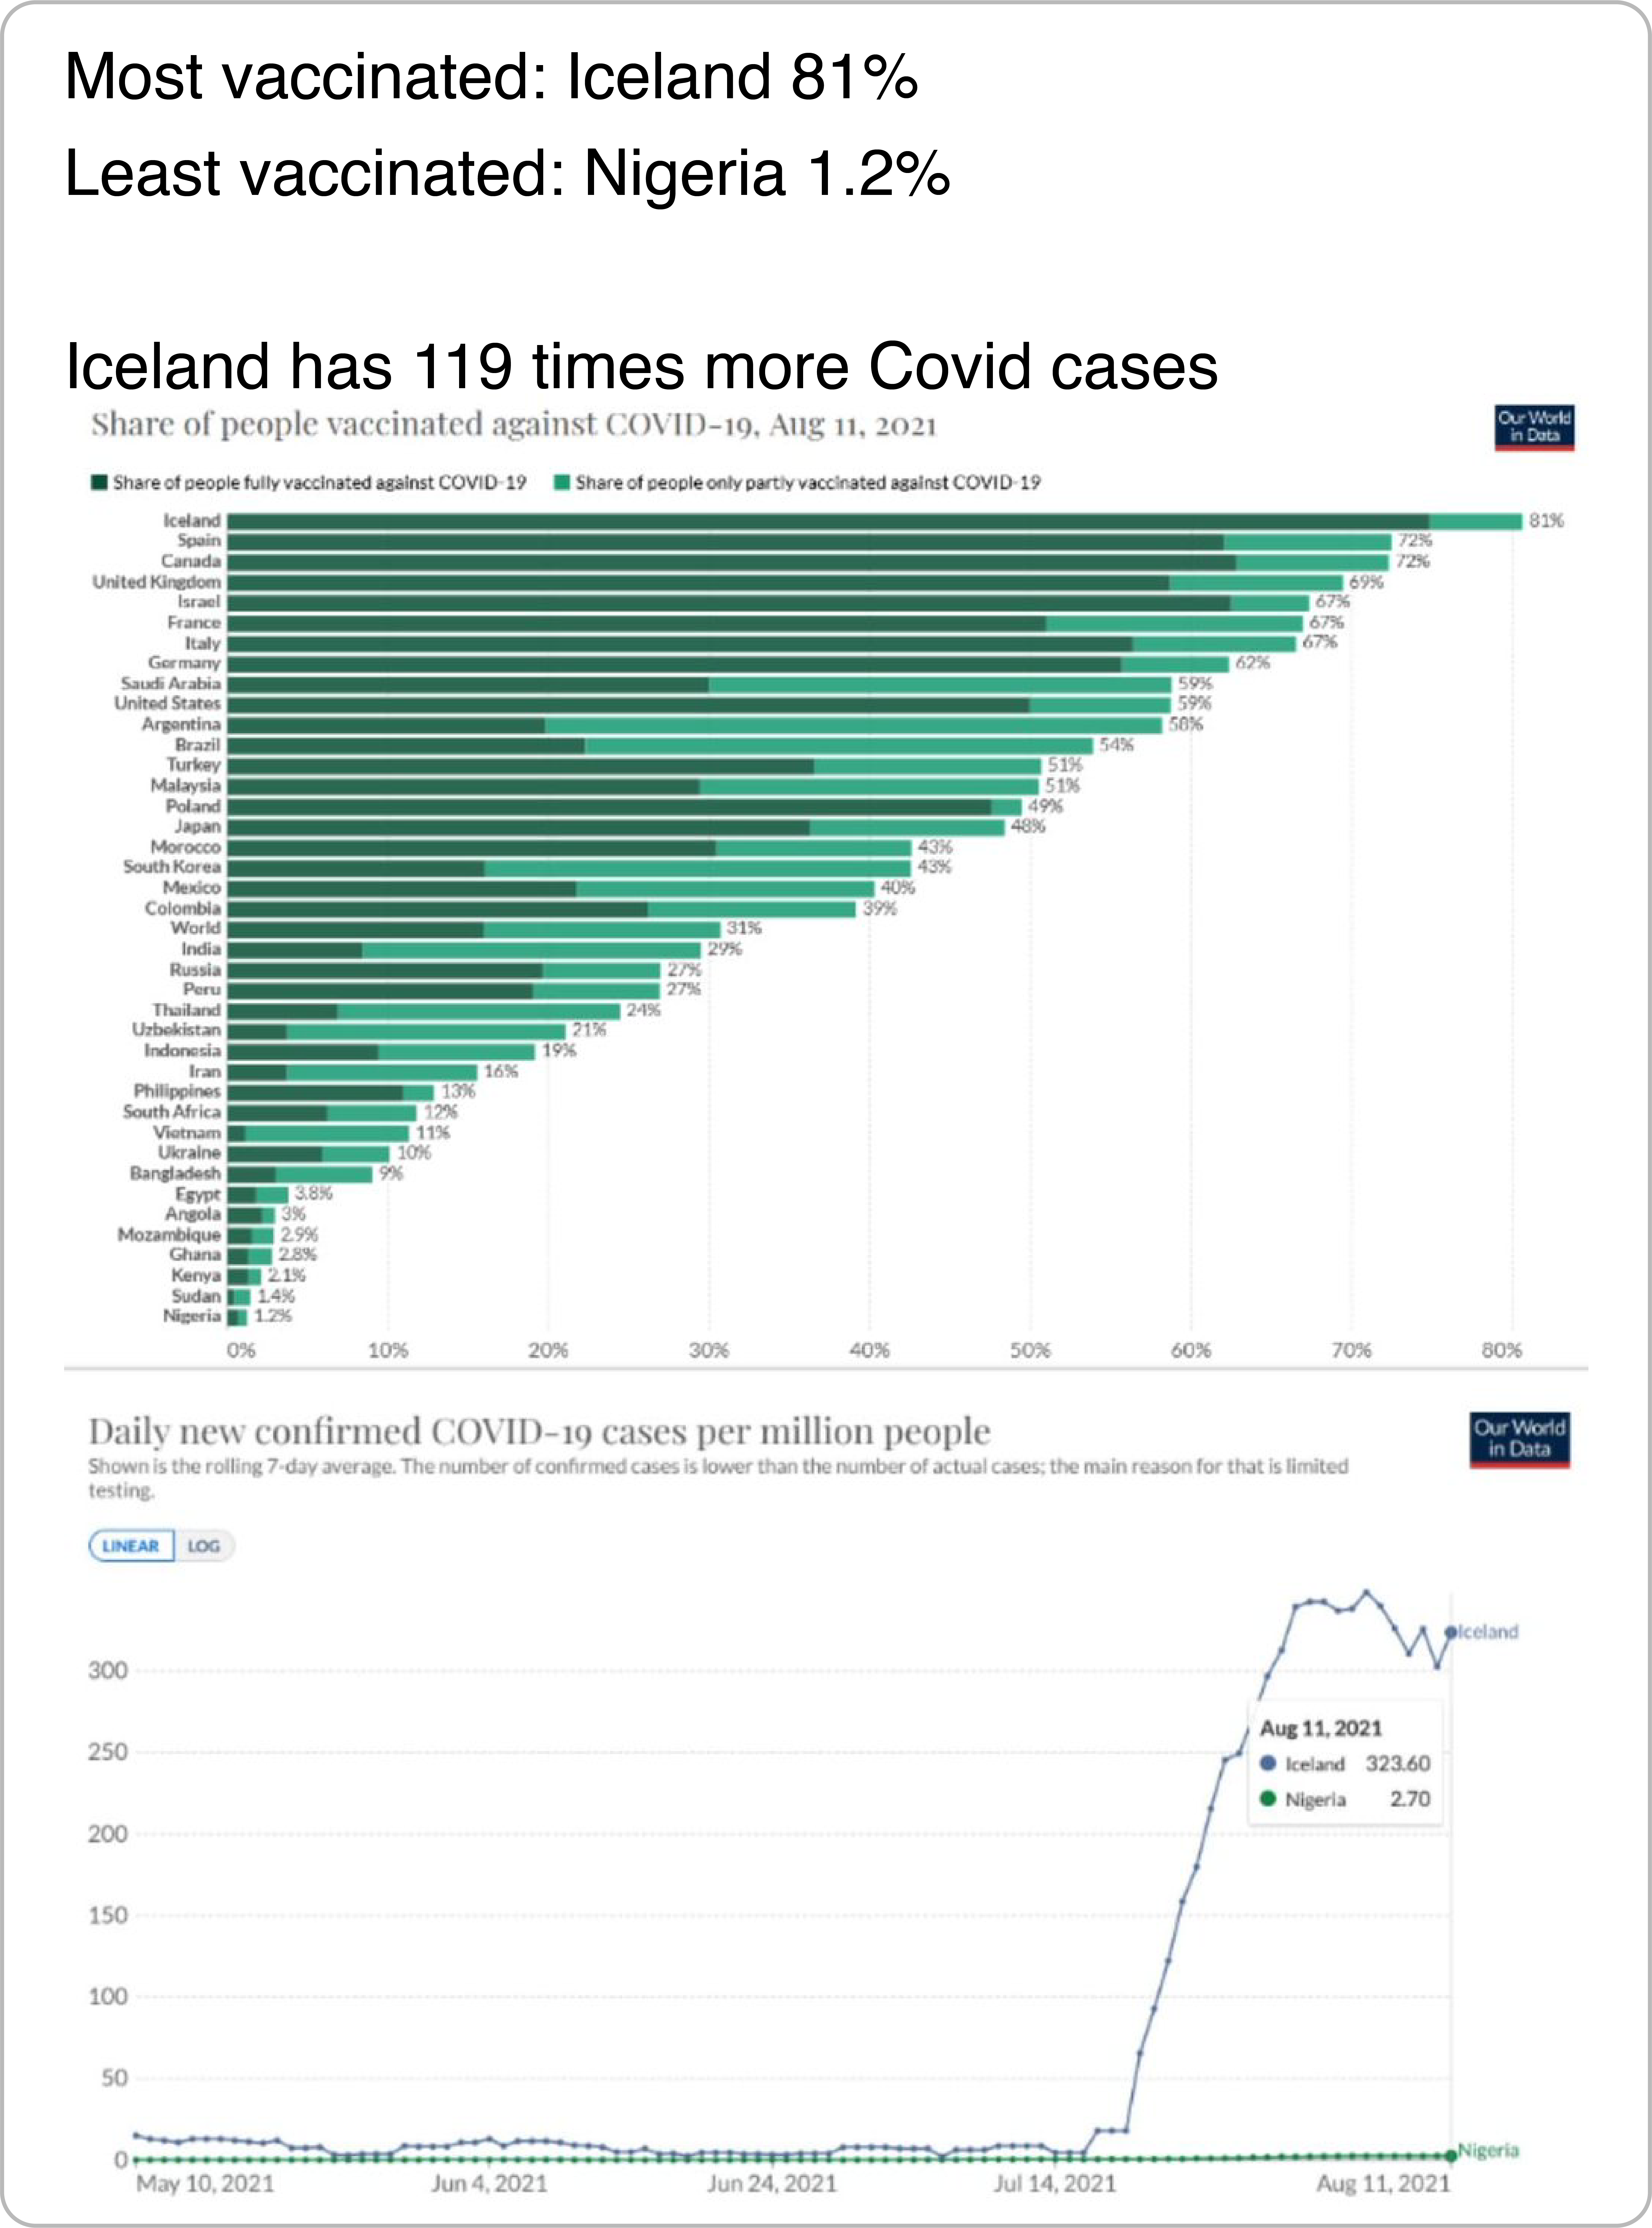
During a fast-developing and novel crisis like COVID, issues may arise with the quality and consistency of data. As a result, many seemingly insightful numbers end up being merely artifacts of inconsistencies in data collection and processing methods. For example, a user shows two charts to highlight the fact that although Iceland is more vaccinated than Nigeria, it is experiencing more COVID-19 cases, implying that vaccines are not effective. The user fails to account, however, for the fact that Iceland had a much higher testing rate—roughly 200 times as high at the time of posting—making it unreasonable to compare the two countries.
Failure to Account for Statistical Nuance
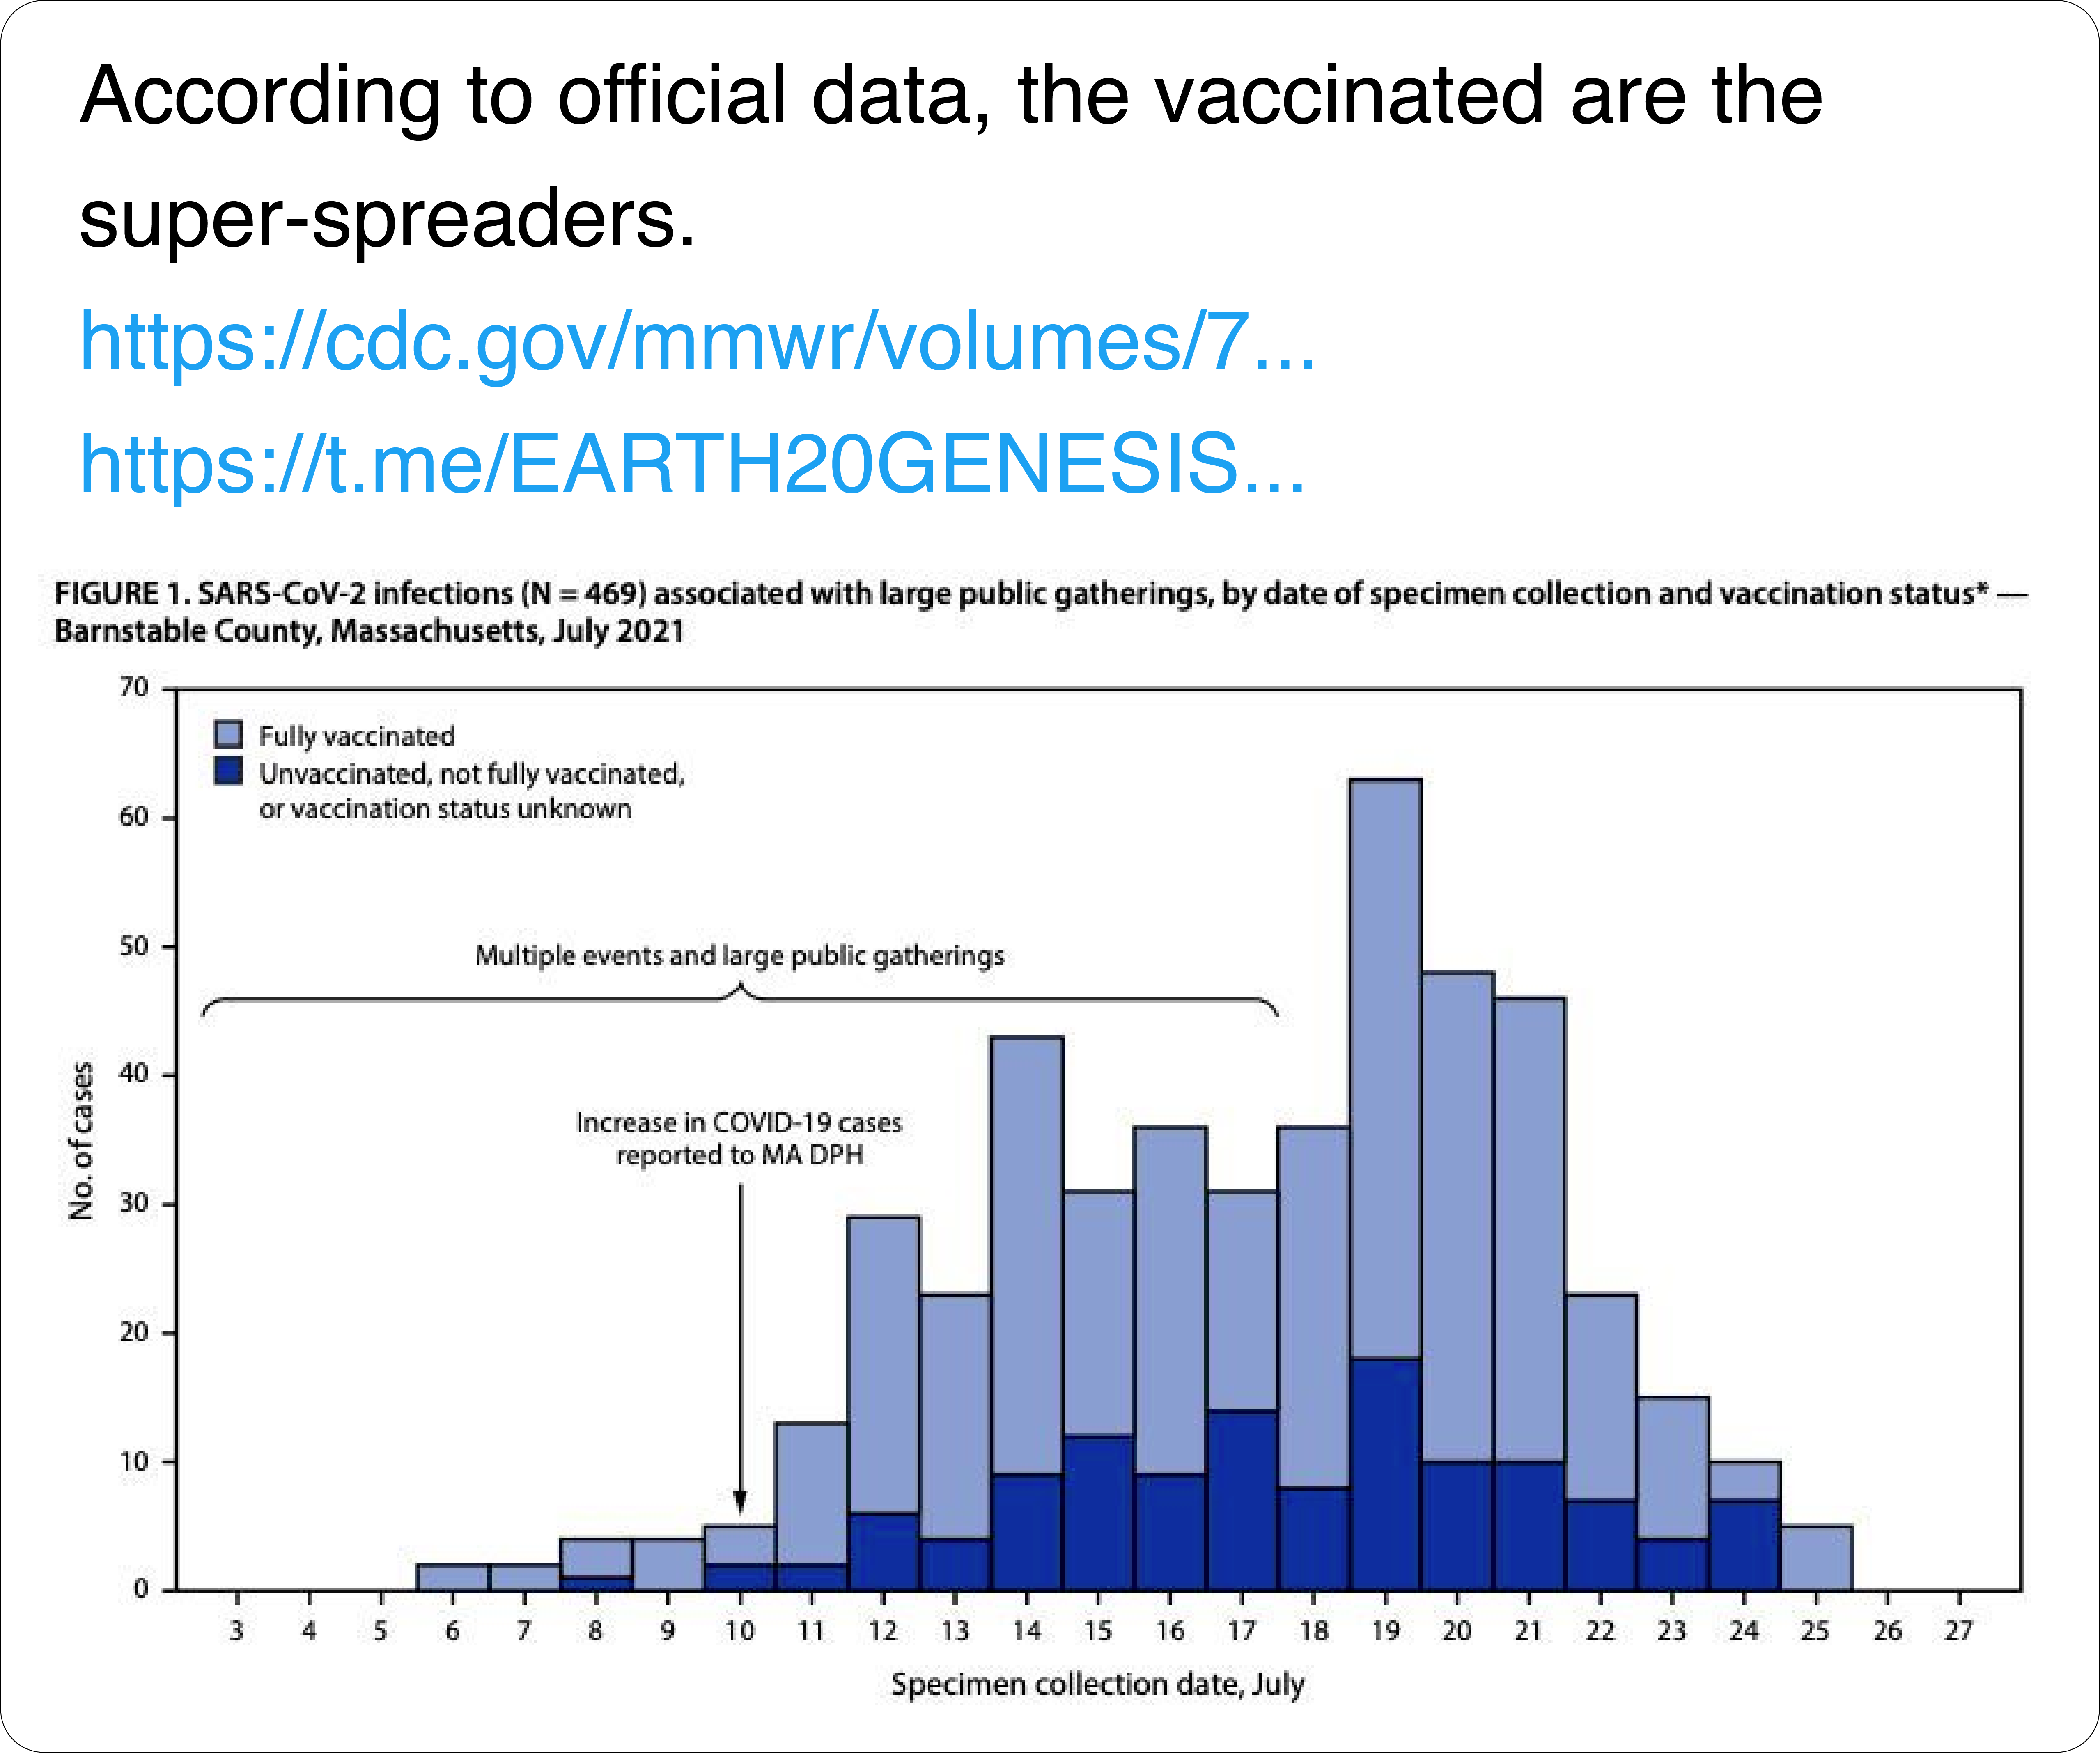
We observe that users often do not account for important statistical nuance in visualizations (if doing so helps support their argument) such as falling prey to the base rate fallacy or related biases. For instance, an author reposts a chart from a CDC report showing COVID-19 cases in Barnstable County, Mass. broken down by vaccinated and unvaccinated individuals. The tweet author suggests that since there are more vaccinated cases, the vaccinated are “super-spreaders.” This interpretation, however, fails to account for the high proportion of vaccinated in the general population—likely as high as 95% at the time of data collection.
Misrepresentation of Scientific Results
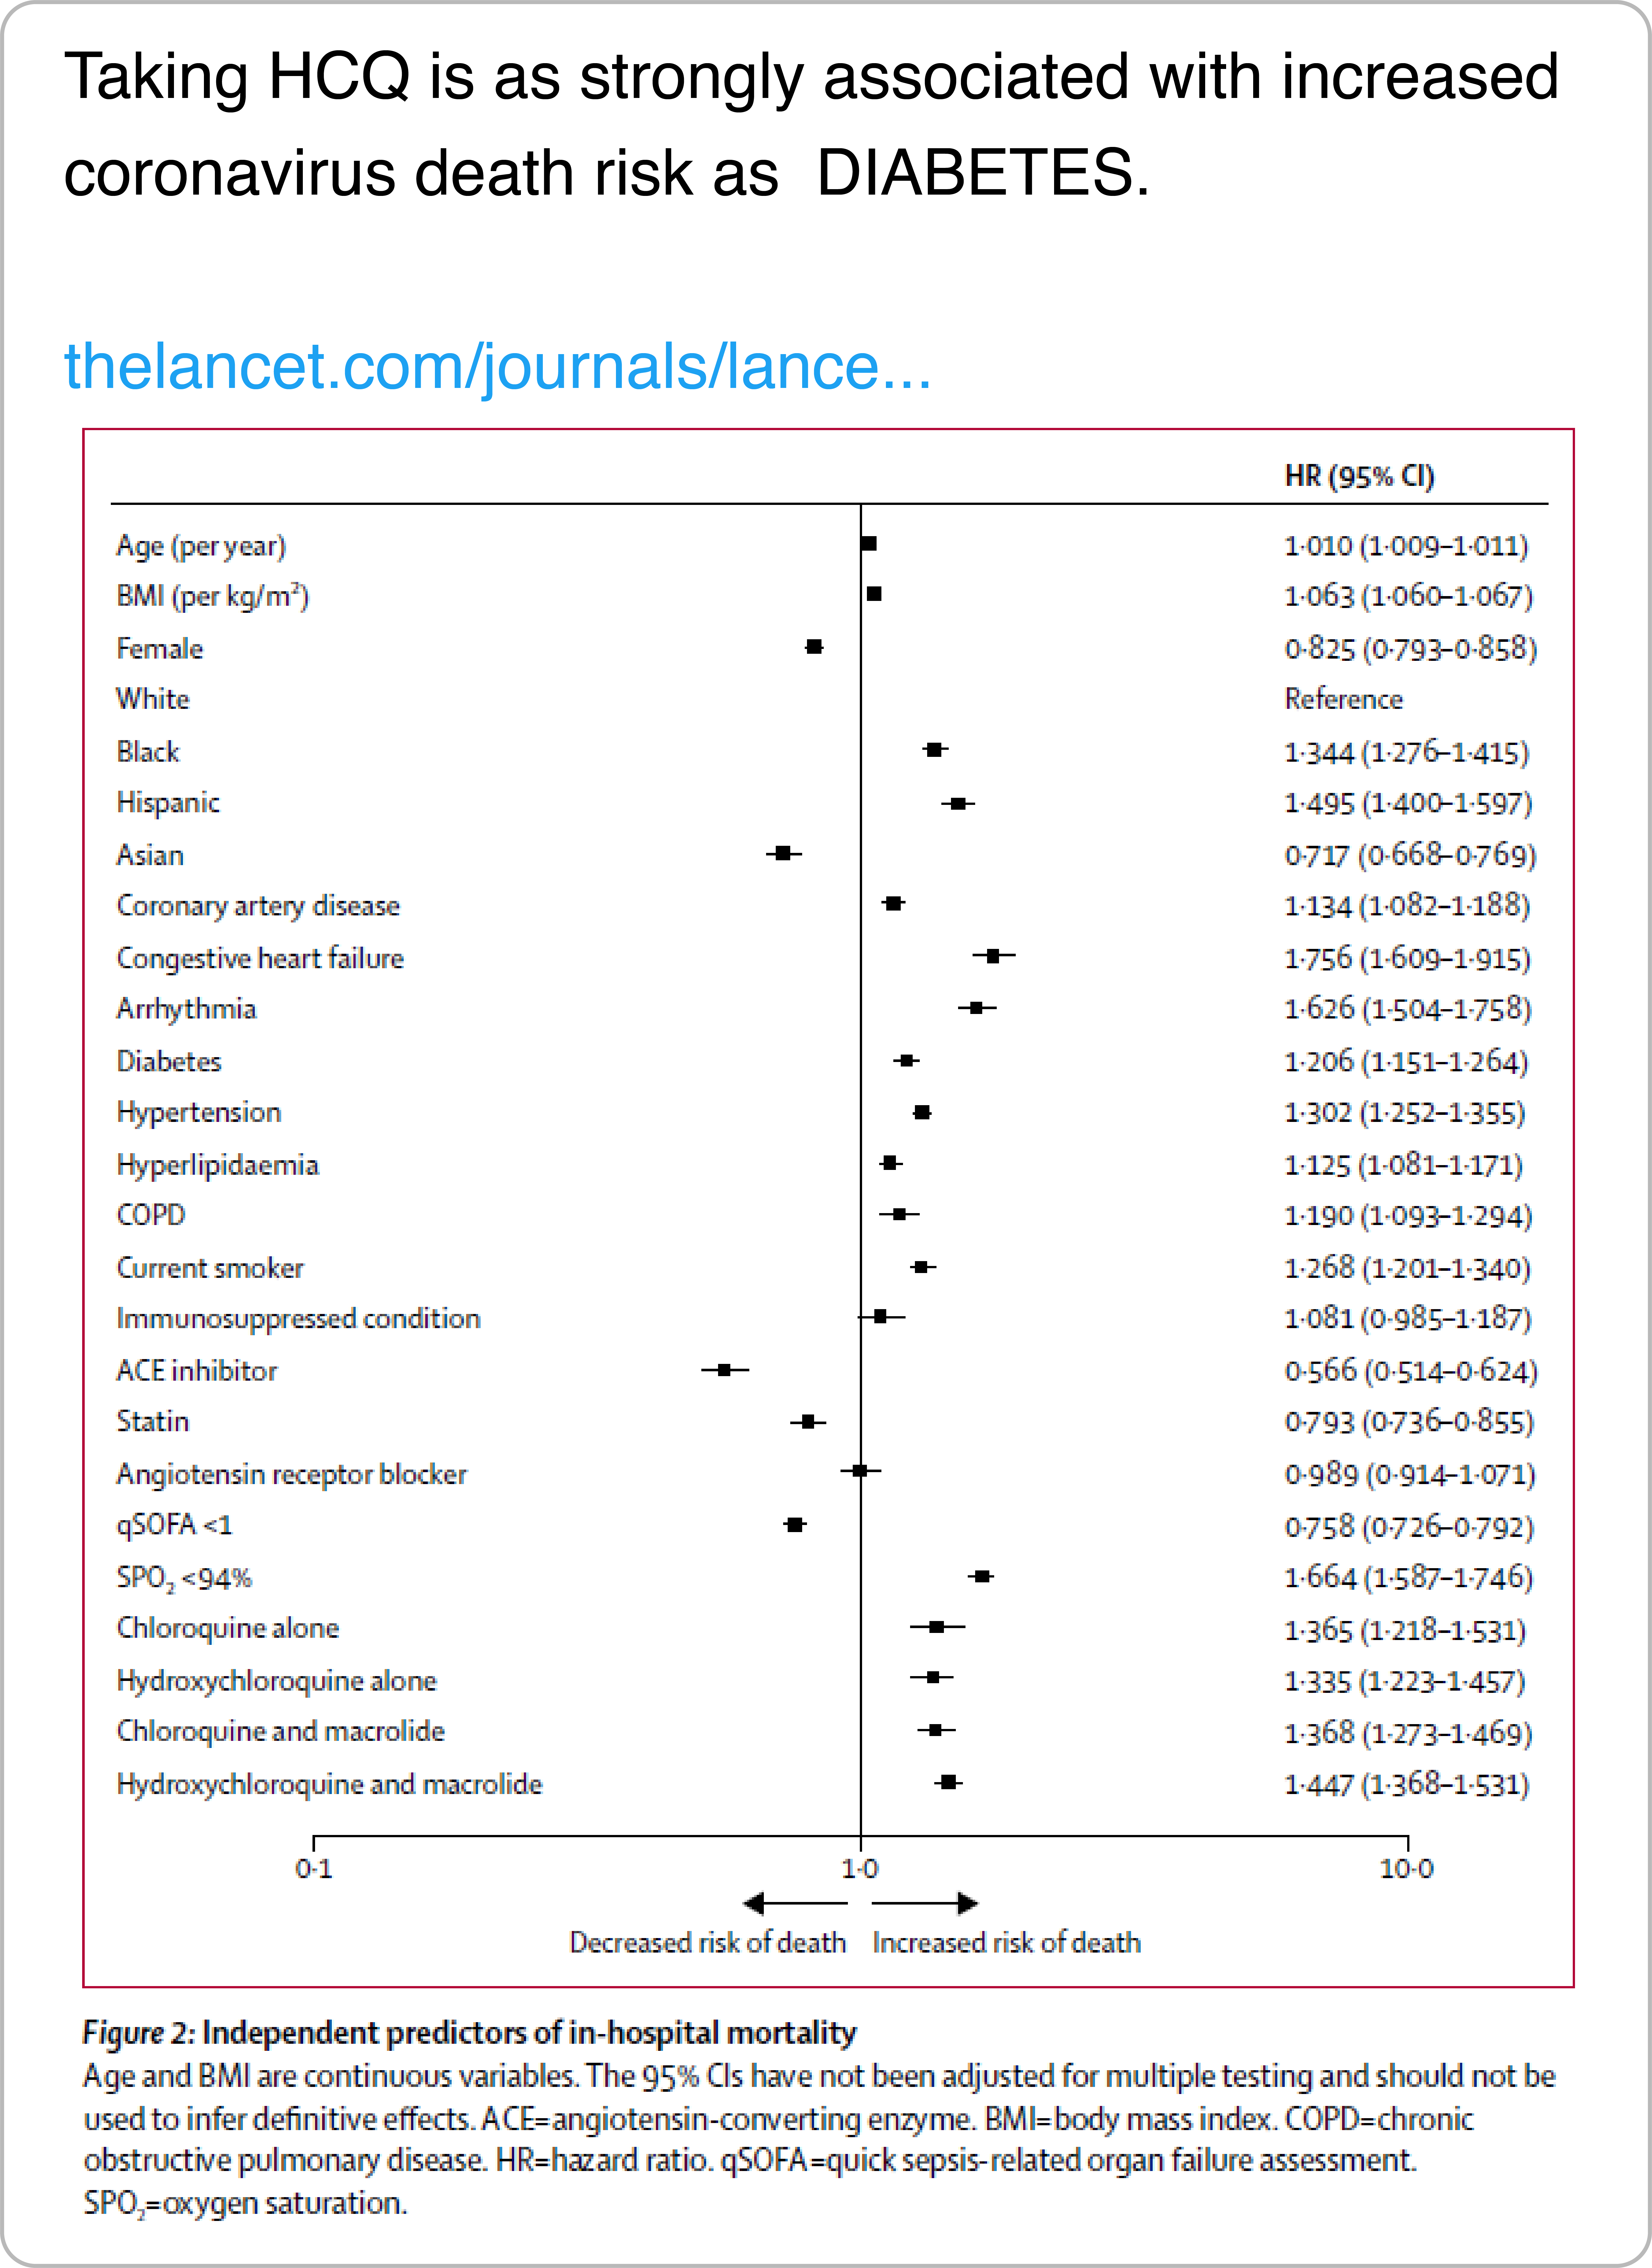
We also identify a type of reasoning in which users accept any scientific findings that align with their prior beliefs at face value—such as studies on the efficacy of certain types of medication that have not yet been peer-reviewed, reproduced, or otherwise scrutinized, e.g., by approval for use in most countries. For instance, this tweet argues against the use of hydroxychloroquine noting that it leads to an increased risk of mortality. The figure comes from a study that has since been retracted due to concerns about the veracity of the data.
So What Could Be Done About It?
We observed that the majority of misleading charts posted on Twitter are screenshots of existing visualizations from government agencies or data exploration websites. These charts were (most likely) created without an intent to deceive, but were later abused, either through framing, or by adding minor annotations. We call such charts vulnerable to misinterpretations. From this it follows that there is an opportunity for visualization designers to safeguard their charts by designing them with a biased reading in mind.
For instance, this could be done by warning users about the dangers of cherry-picking or spurious correlations in data exploration tools, by communicating the uncertainty in estimates, or by adding notes and annotations attempting to explain sharp rises or drops in the data. Without this important information, people use their biases to fill in the gaps between striking visual features in the chart and their interpretations.
For more details about reasoning errors in visualization posts make sure to check out our paper!
The Paper
This blog post is based on the following paper:
Misleading Beyond Visual Tricks: How People Actually Lie with Charts
SIGCHI Conference on Human Factors in Computing Systems (CHI), 2023