Abstract
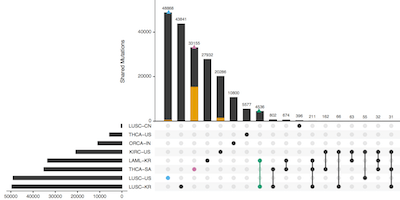
The analysis of set data is a mainstay in biomedical research. BioMedical applications of set visualizations range from analyzing shared genes between species, phenotypes in cancer, or single-cell transcriptome data. Traditionally, set visualization has been done with Venn and Euler diagrams, which scale poorly beyond three or four sets. To address this problem, we have developed the UpSet visualization technique, which has become the canonical way to visualize set relationships for data with more than three sets. Since then, the R version of UpSet has been downloaded from CRAN close to a million times, the interactive web versions we maintain are accessed by hundreds of researchers every week, and the papers introducing UpSet and the UpSet R version have been cited more than 2000 times. Furthermore, we are aware of 11 different implementations of UpSet in various programming languages. We have recently launched a community platform http://upset.app explaining the UpSet technique and describing the various implementations. Despite these successes, there remain challenges, which we aim to address in this proposal.
A key challenge is that UpSet plots are, like most scientific plots, not accessible in two different ways: first, they cannot be read by low vision or blind users; second they cannot be created by analysts who don’t write code.
The primary objective of this proposal is to work with members of the low-vision and blind community to make UpSet plots accessible to readers (consumers) and analysts (creators) with vision deficiencies. To enable accessible creation of UpSet plots, we will develop workflows that are compatible with screen readers and other assistive devices/techniques (magnification, etc.) To make UpSet plots readable by the low vision community, we will develop an alt-text template generator for UpSet plots, summarizing relevant patterns but also providing access to layered information. These templates can then be customized by an analyst to highlight key aspects and provide domain specific context. This work will also serve as a test-bed for making other types of charts accessible.
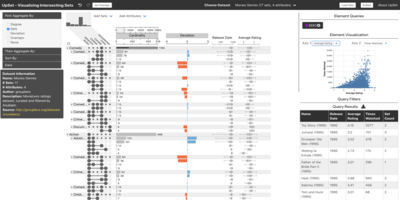
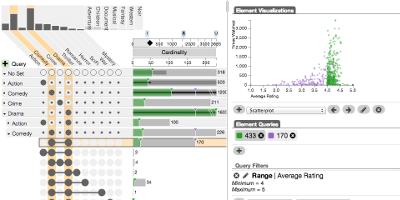
Our second objective is to make it easy to create and share UpSet plots by users who don’t code. To achieve this, we propose to harden and deploy our current interactive, web-based version of UpSet. As part of the work proposed, we will create a public server where analysts can upload their datasets, analyze it, and share or embed interactive upset versions. We will also continue development so that UpSet can be used as a component in other applications.
In support of these objectives, we will develop a configuration format to recreate UpSet plots in other implementations. This will also allow all implementations to leverage the accessibility features we provide. We will implement interfaces to this configuration for at least one popular implementation targeting the web, Python, and R.
Finally, we will continue our community engagement efforts, such as improving the documentation website upset.app, improving documentation and examples for the UpSet web and UpSetR versions, and address issues brought up by the community.
Publications
UpSet 2: From Prototype to Tool
Proceedings of the IEEE Information Visualization Conference – Posters (InfoVis ’19), 2019
UpSetR: An R Package For The Visualization Of Intersecting Sets And Their Properties
Bioinformatics, 2017
UpSet: Visualization of Intersecting Sets
IEEE Transactions on Visualization and Computer Graphics (InfoVis), 2014
10 Year InfoVis Test of Time Award, 2024