Abstract
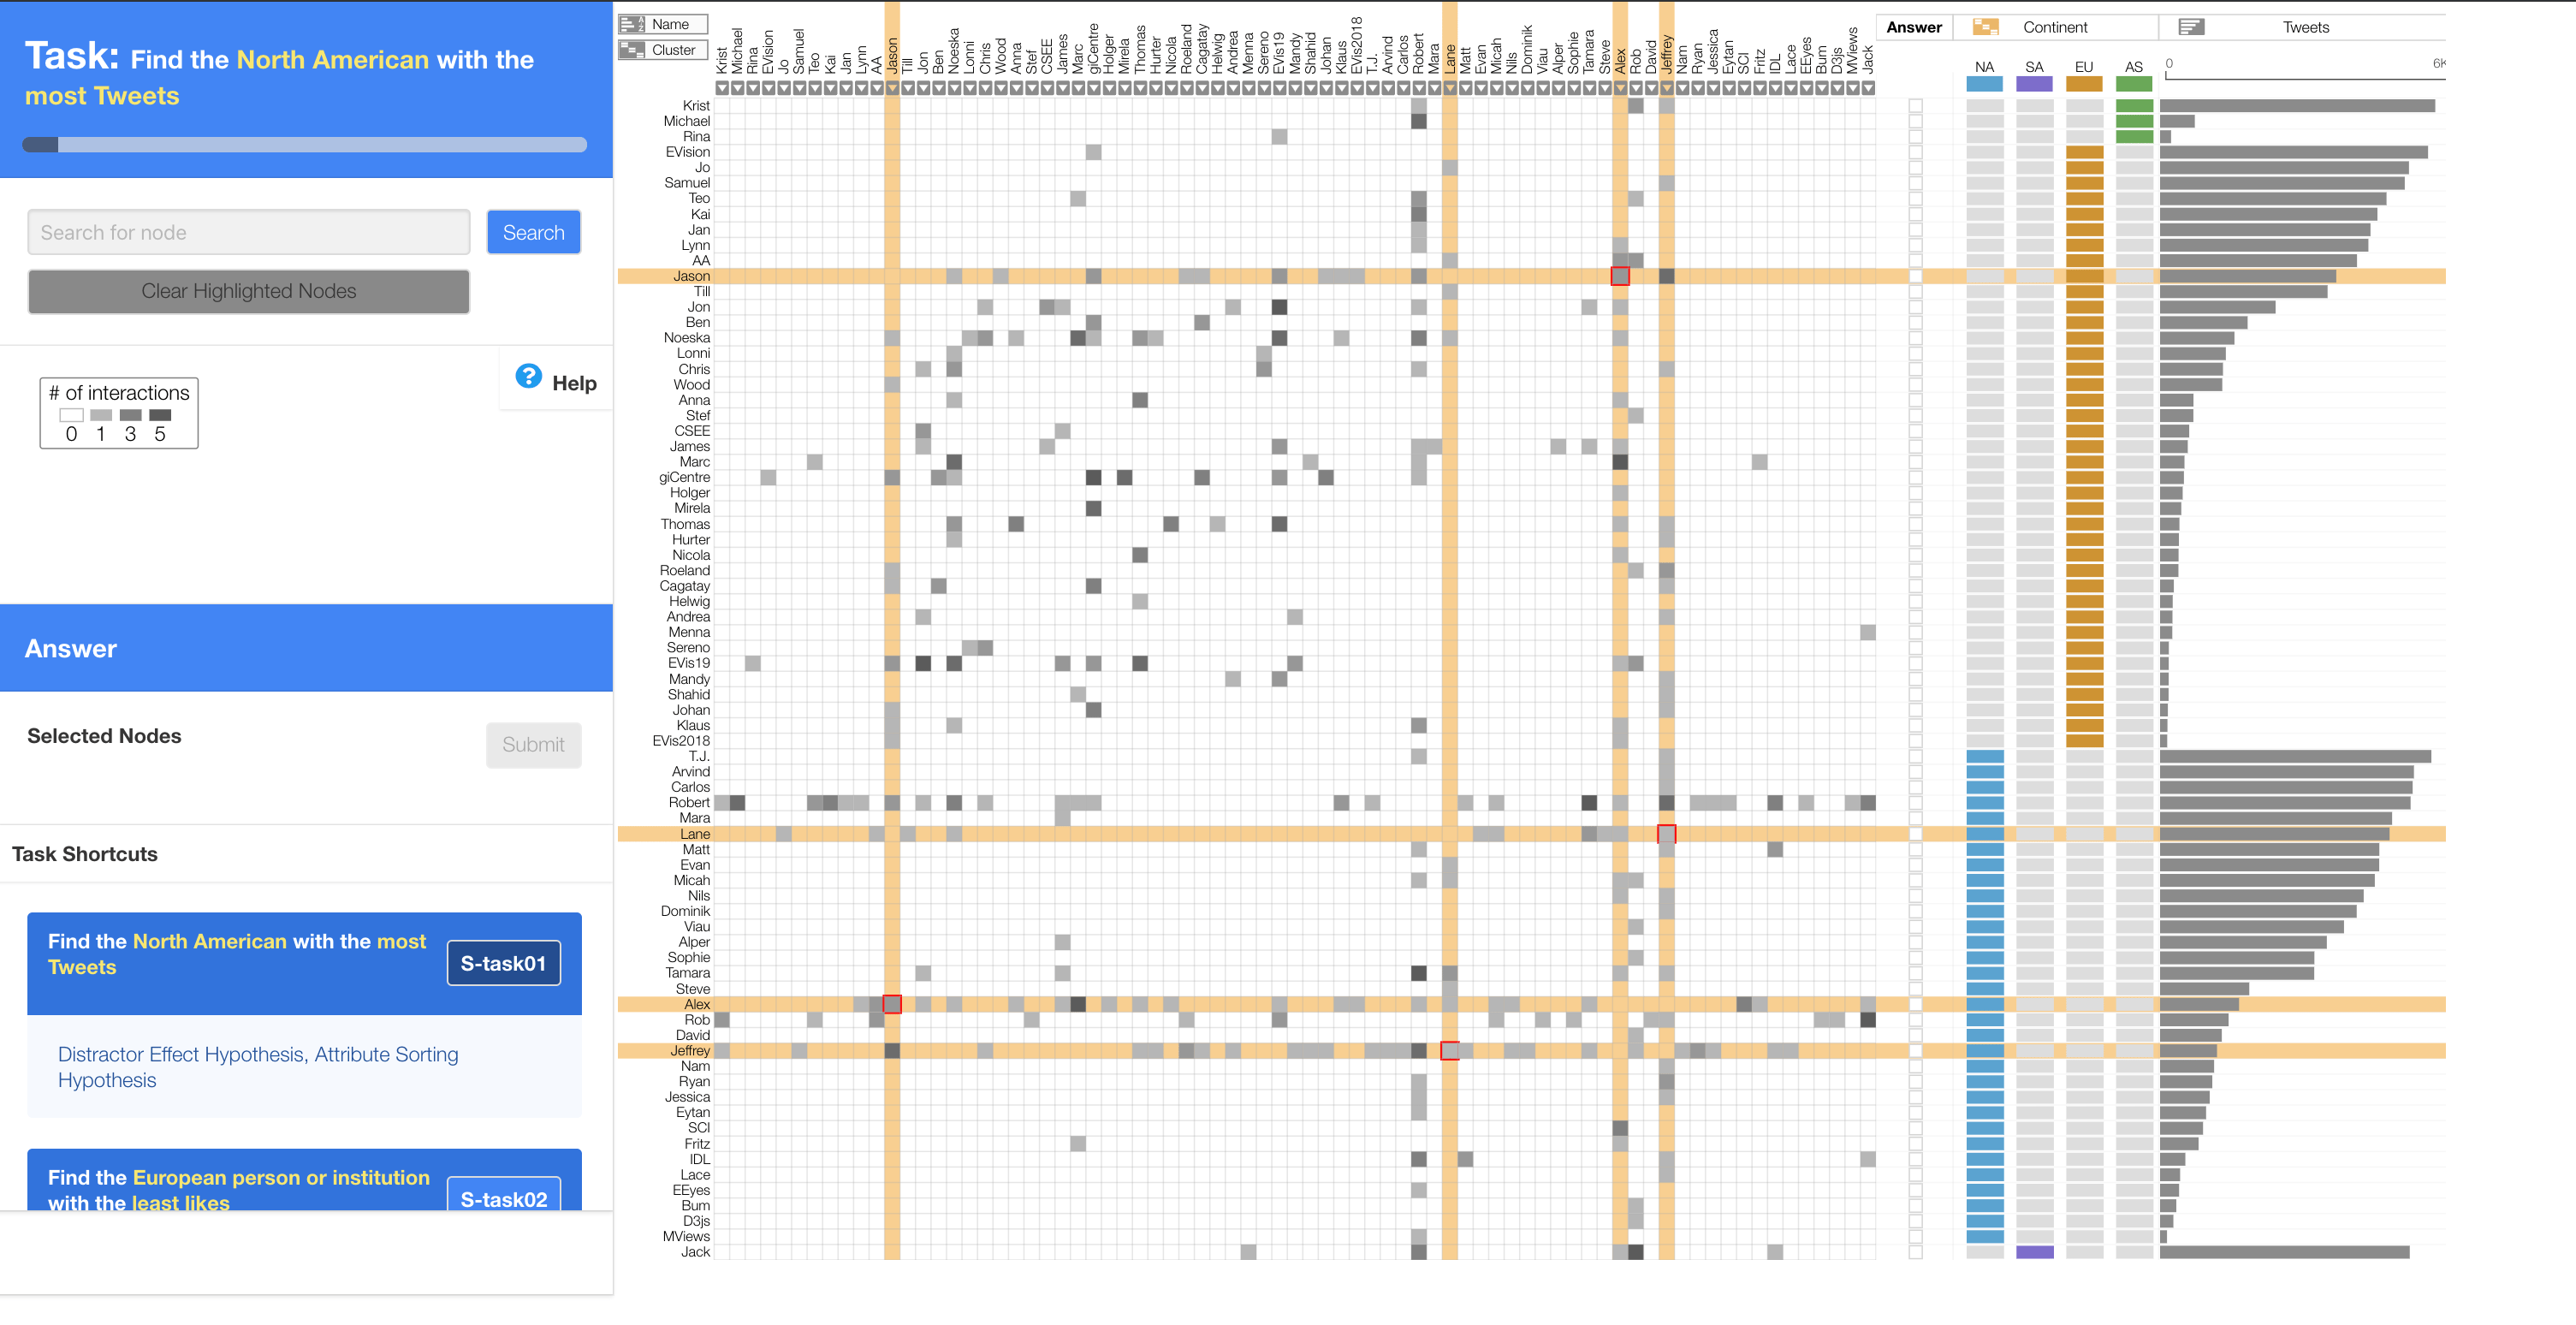
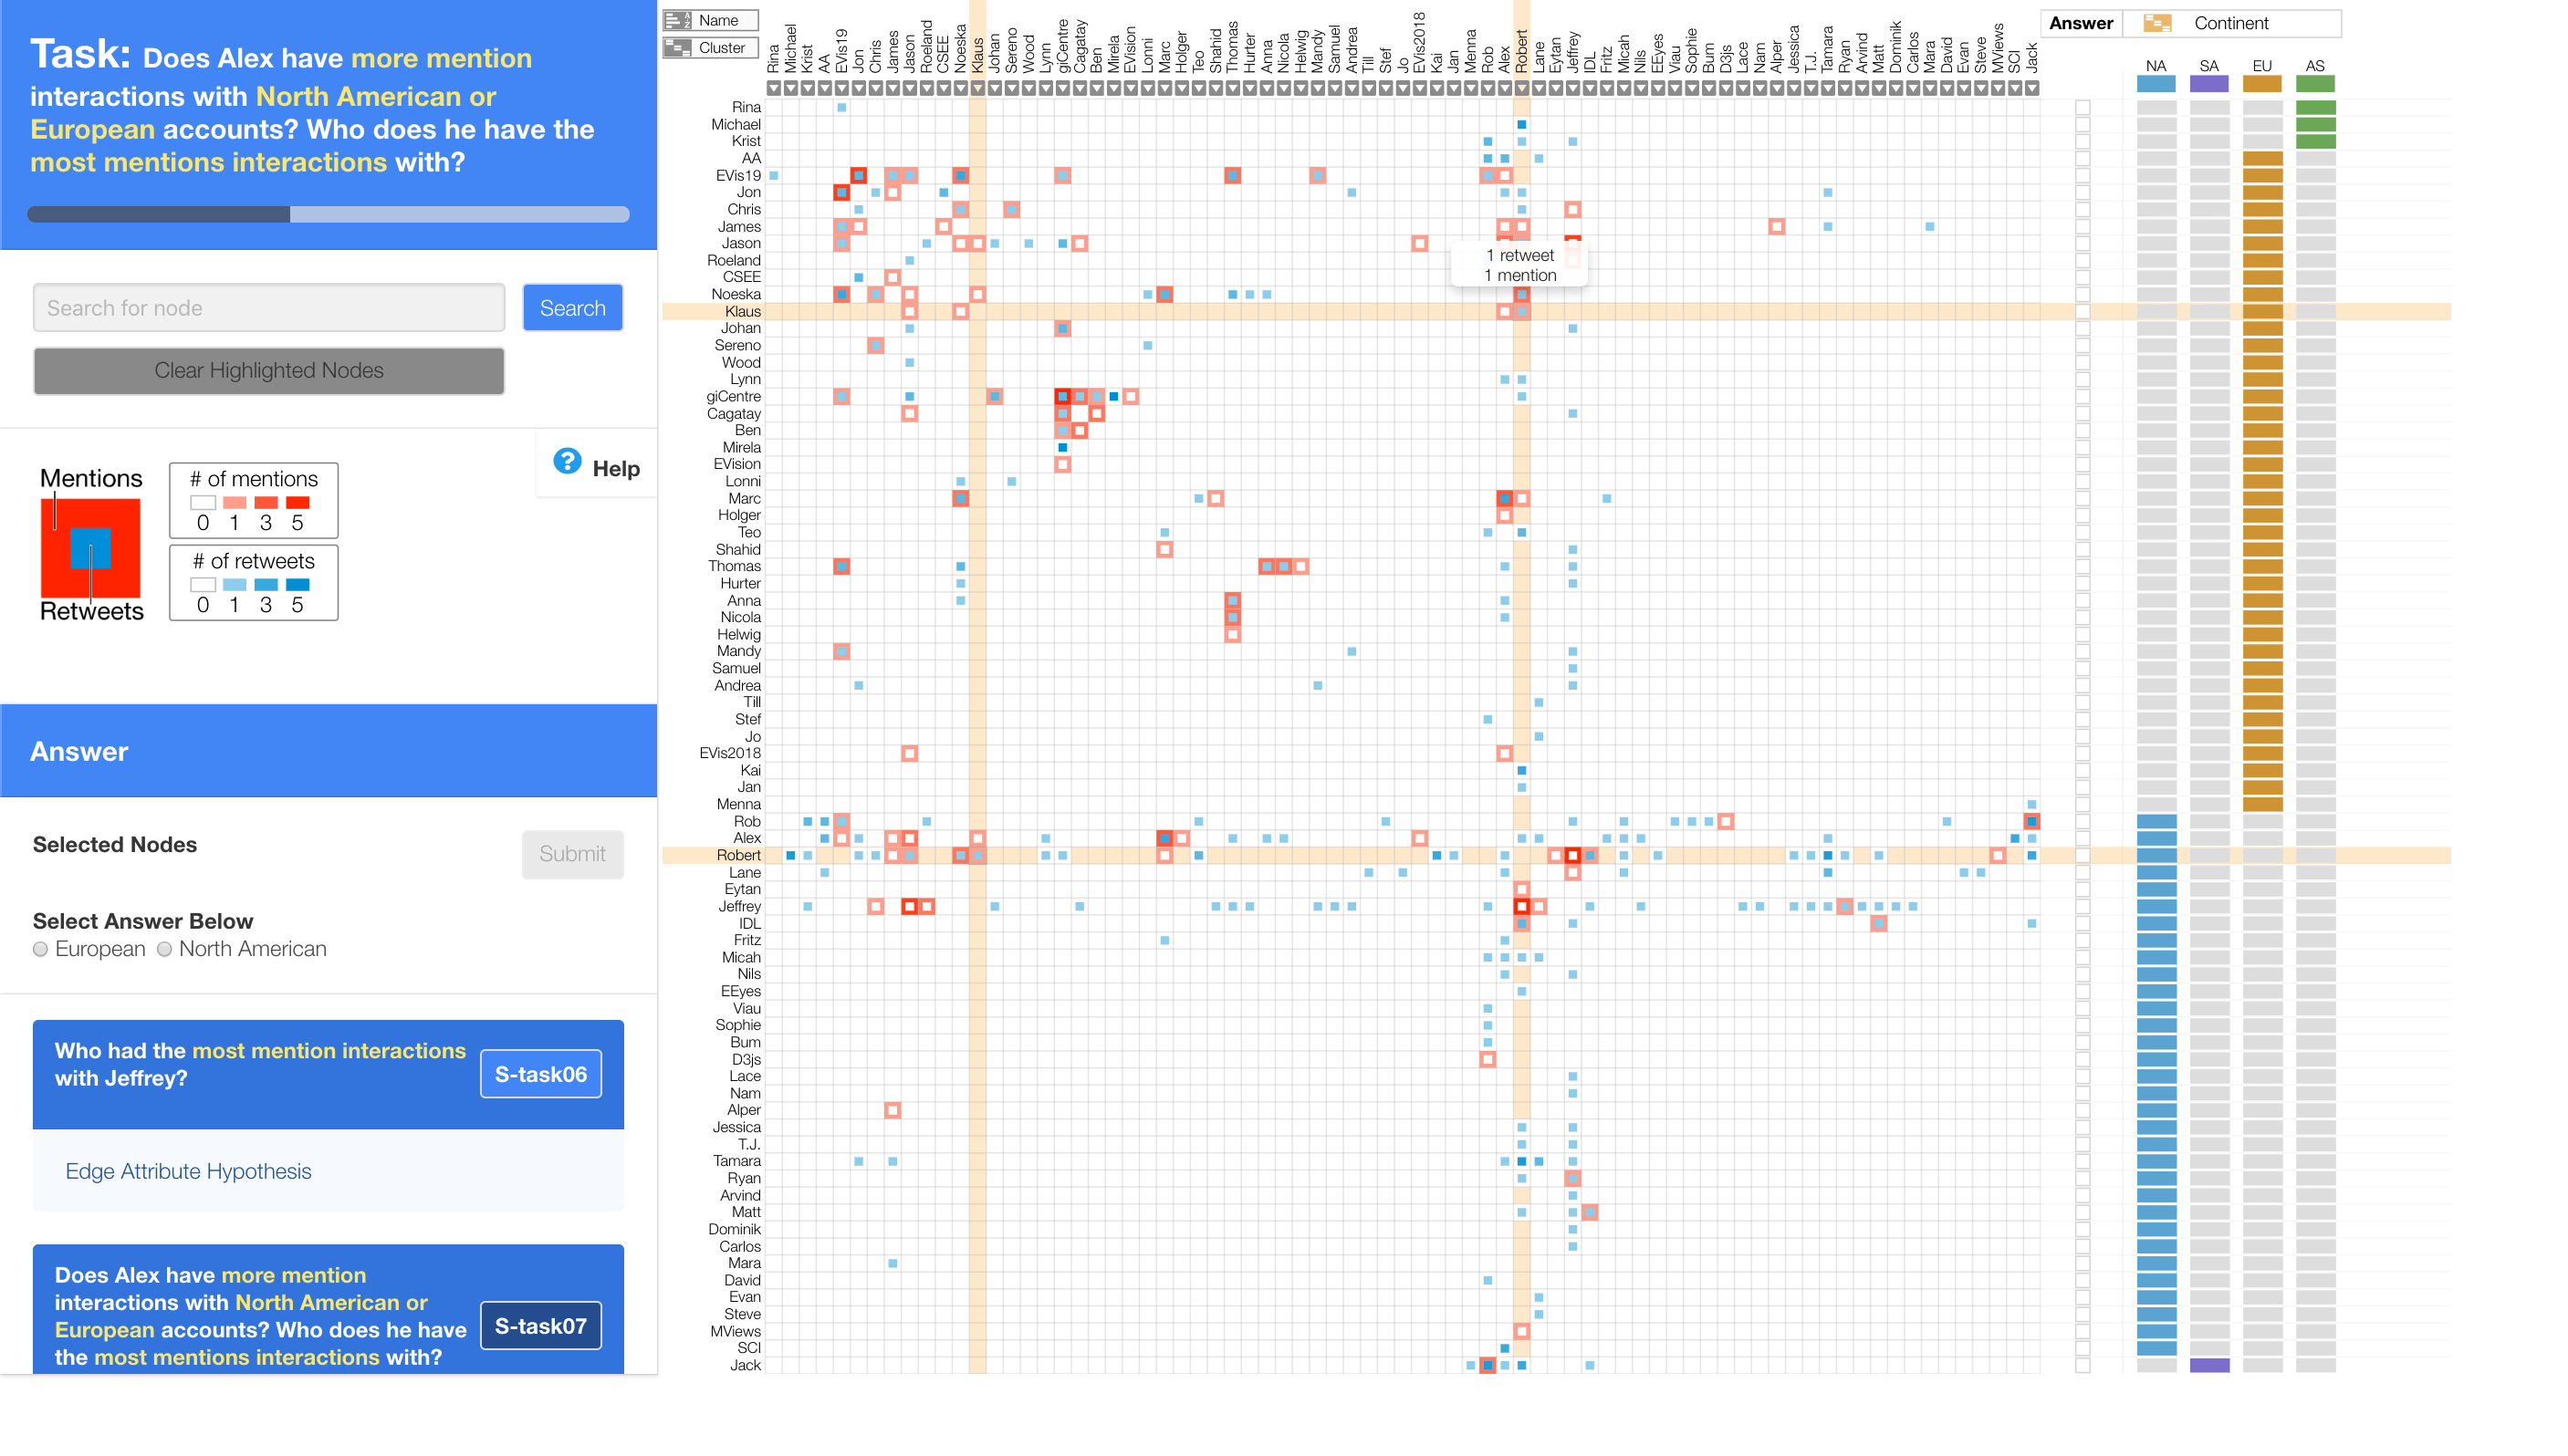
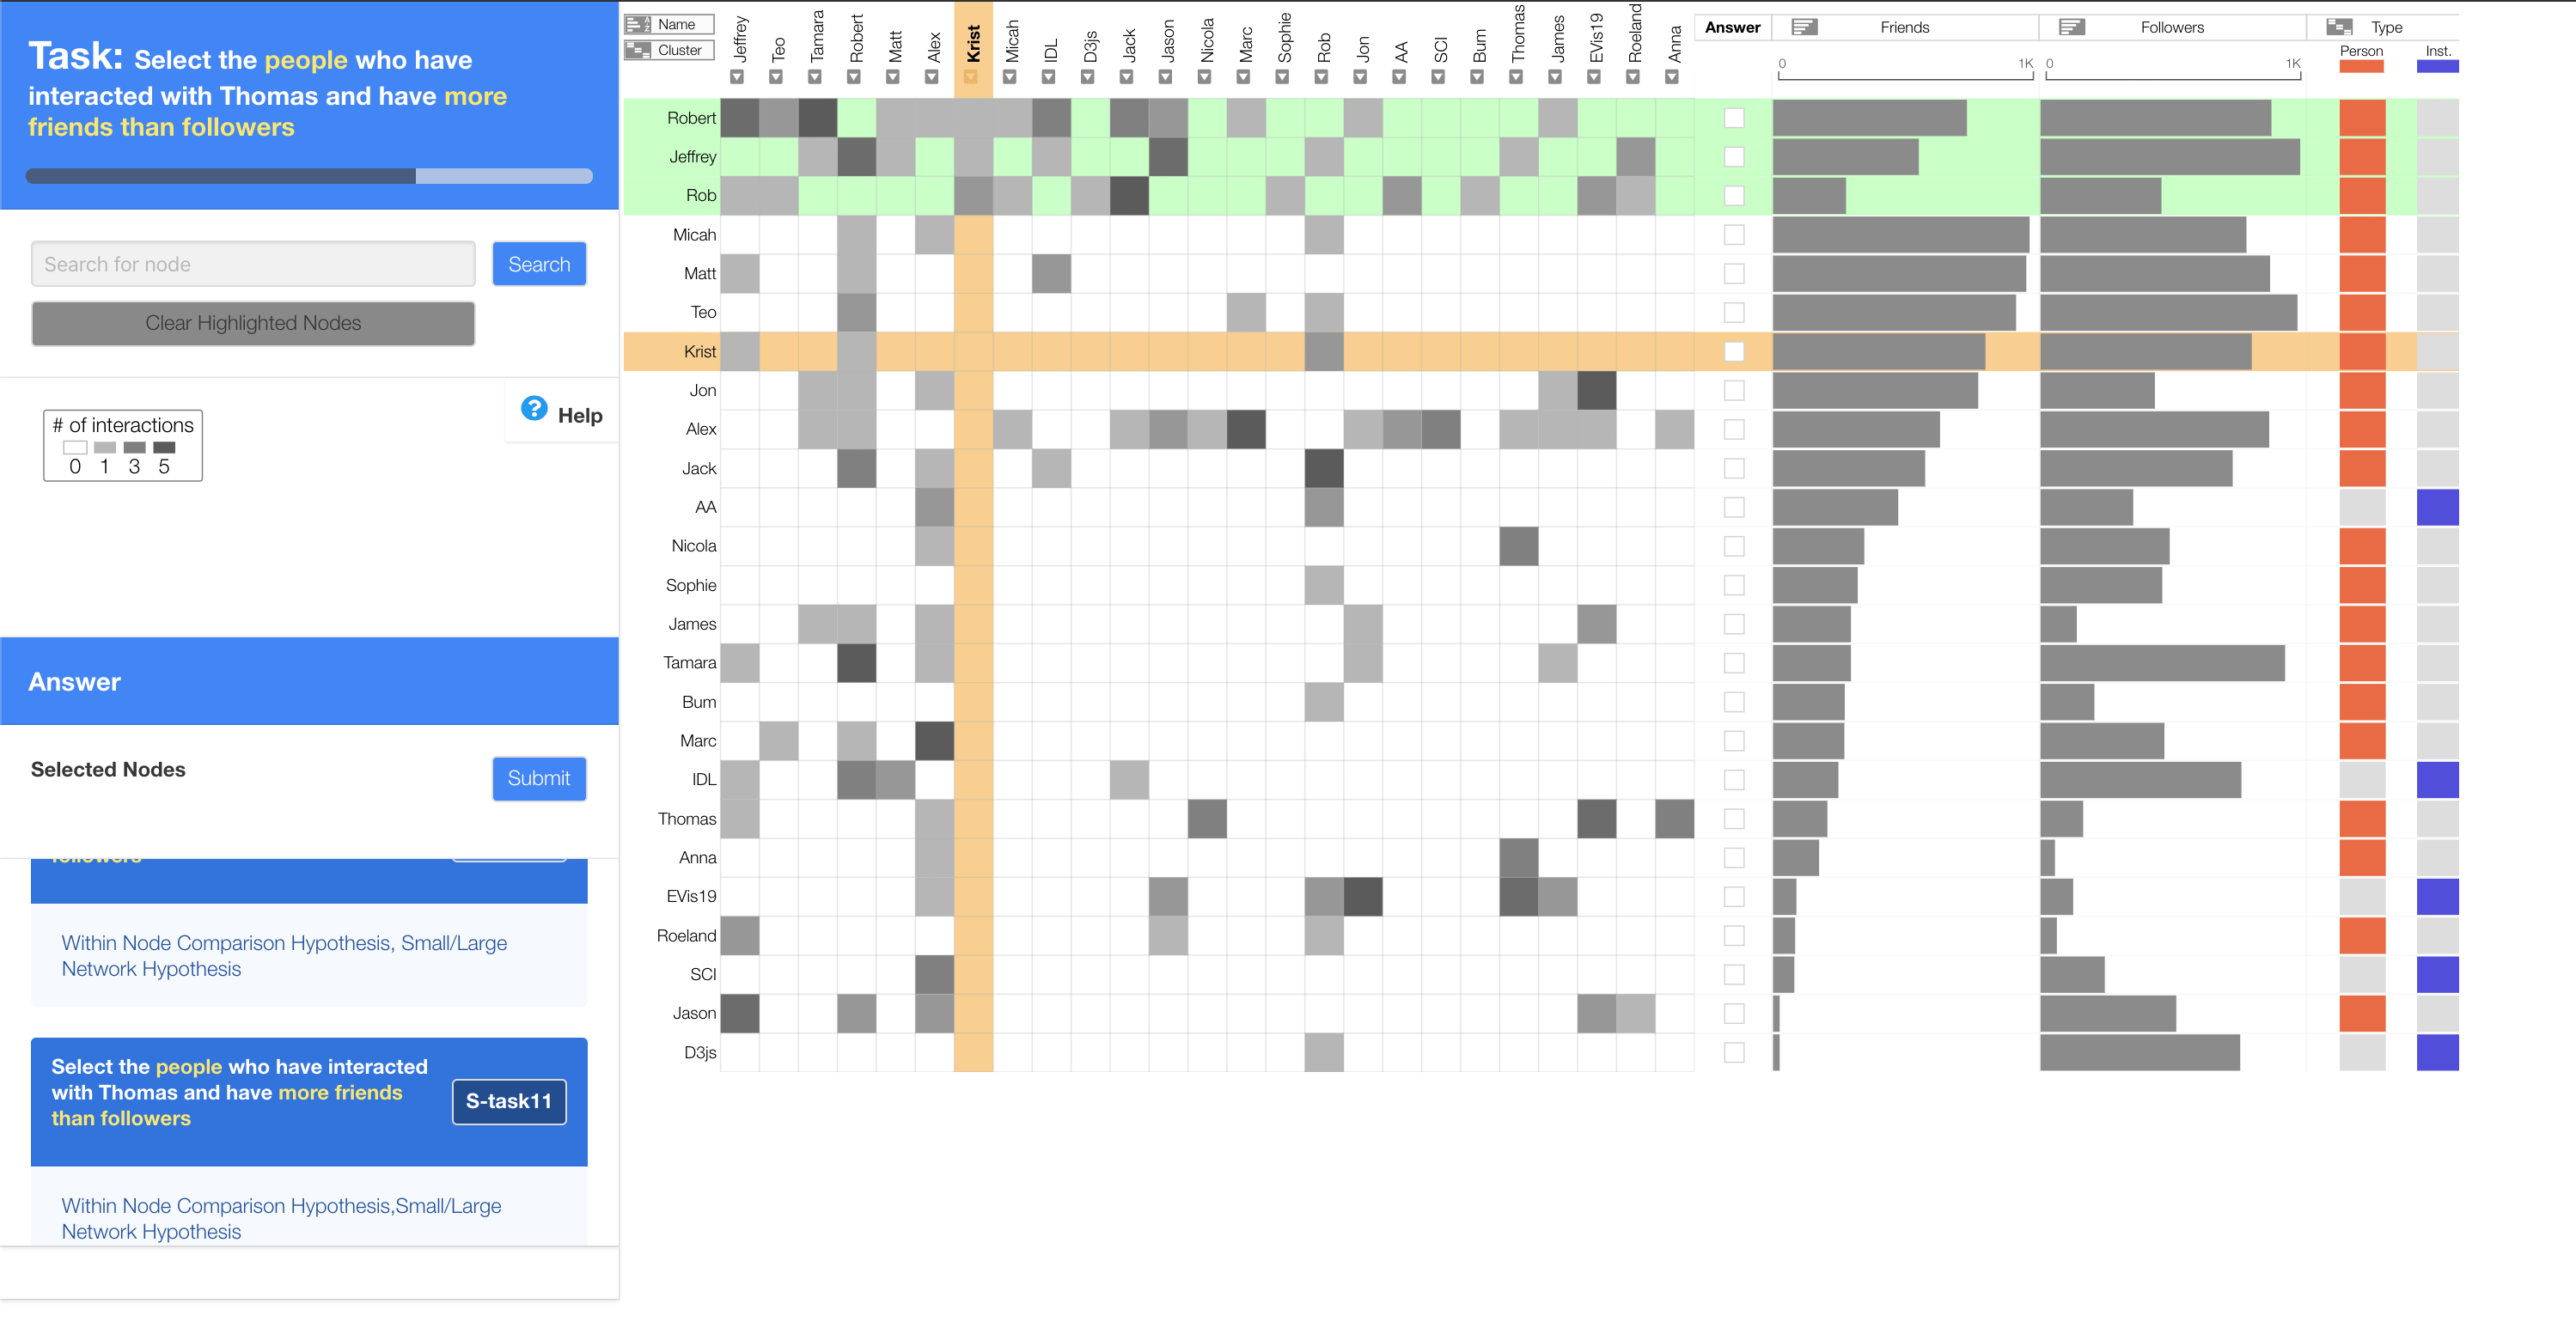
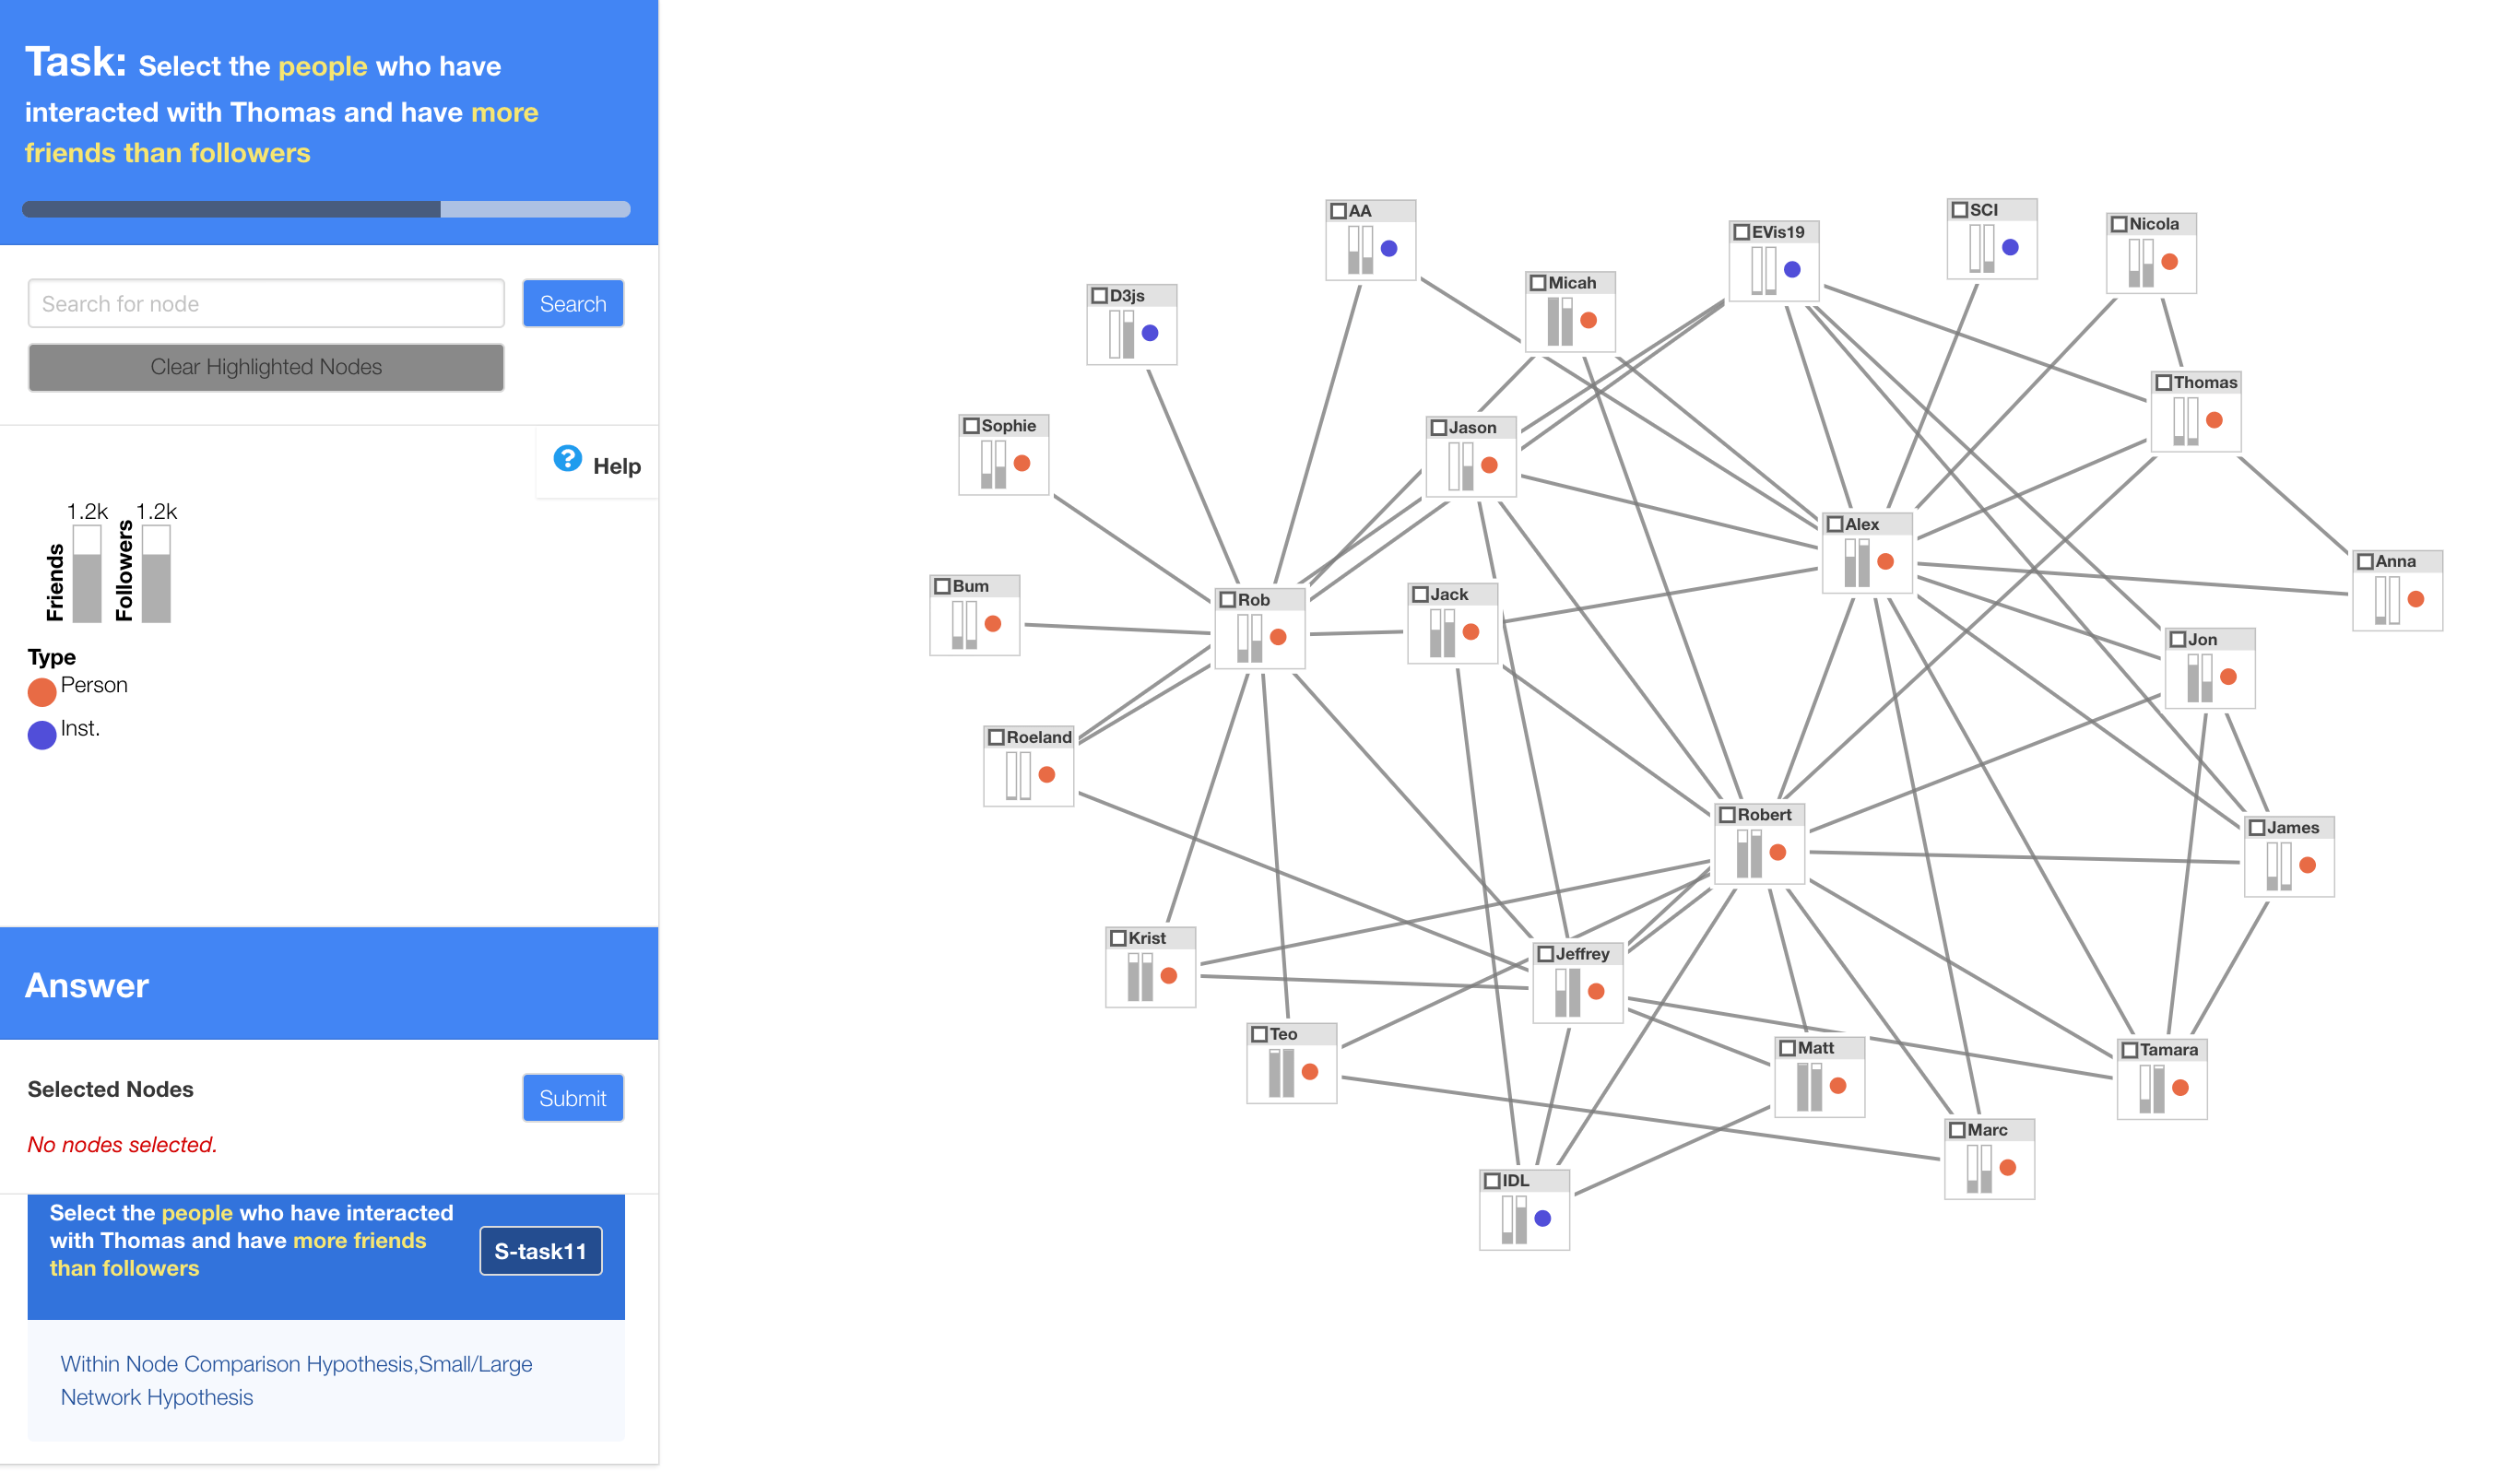
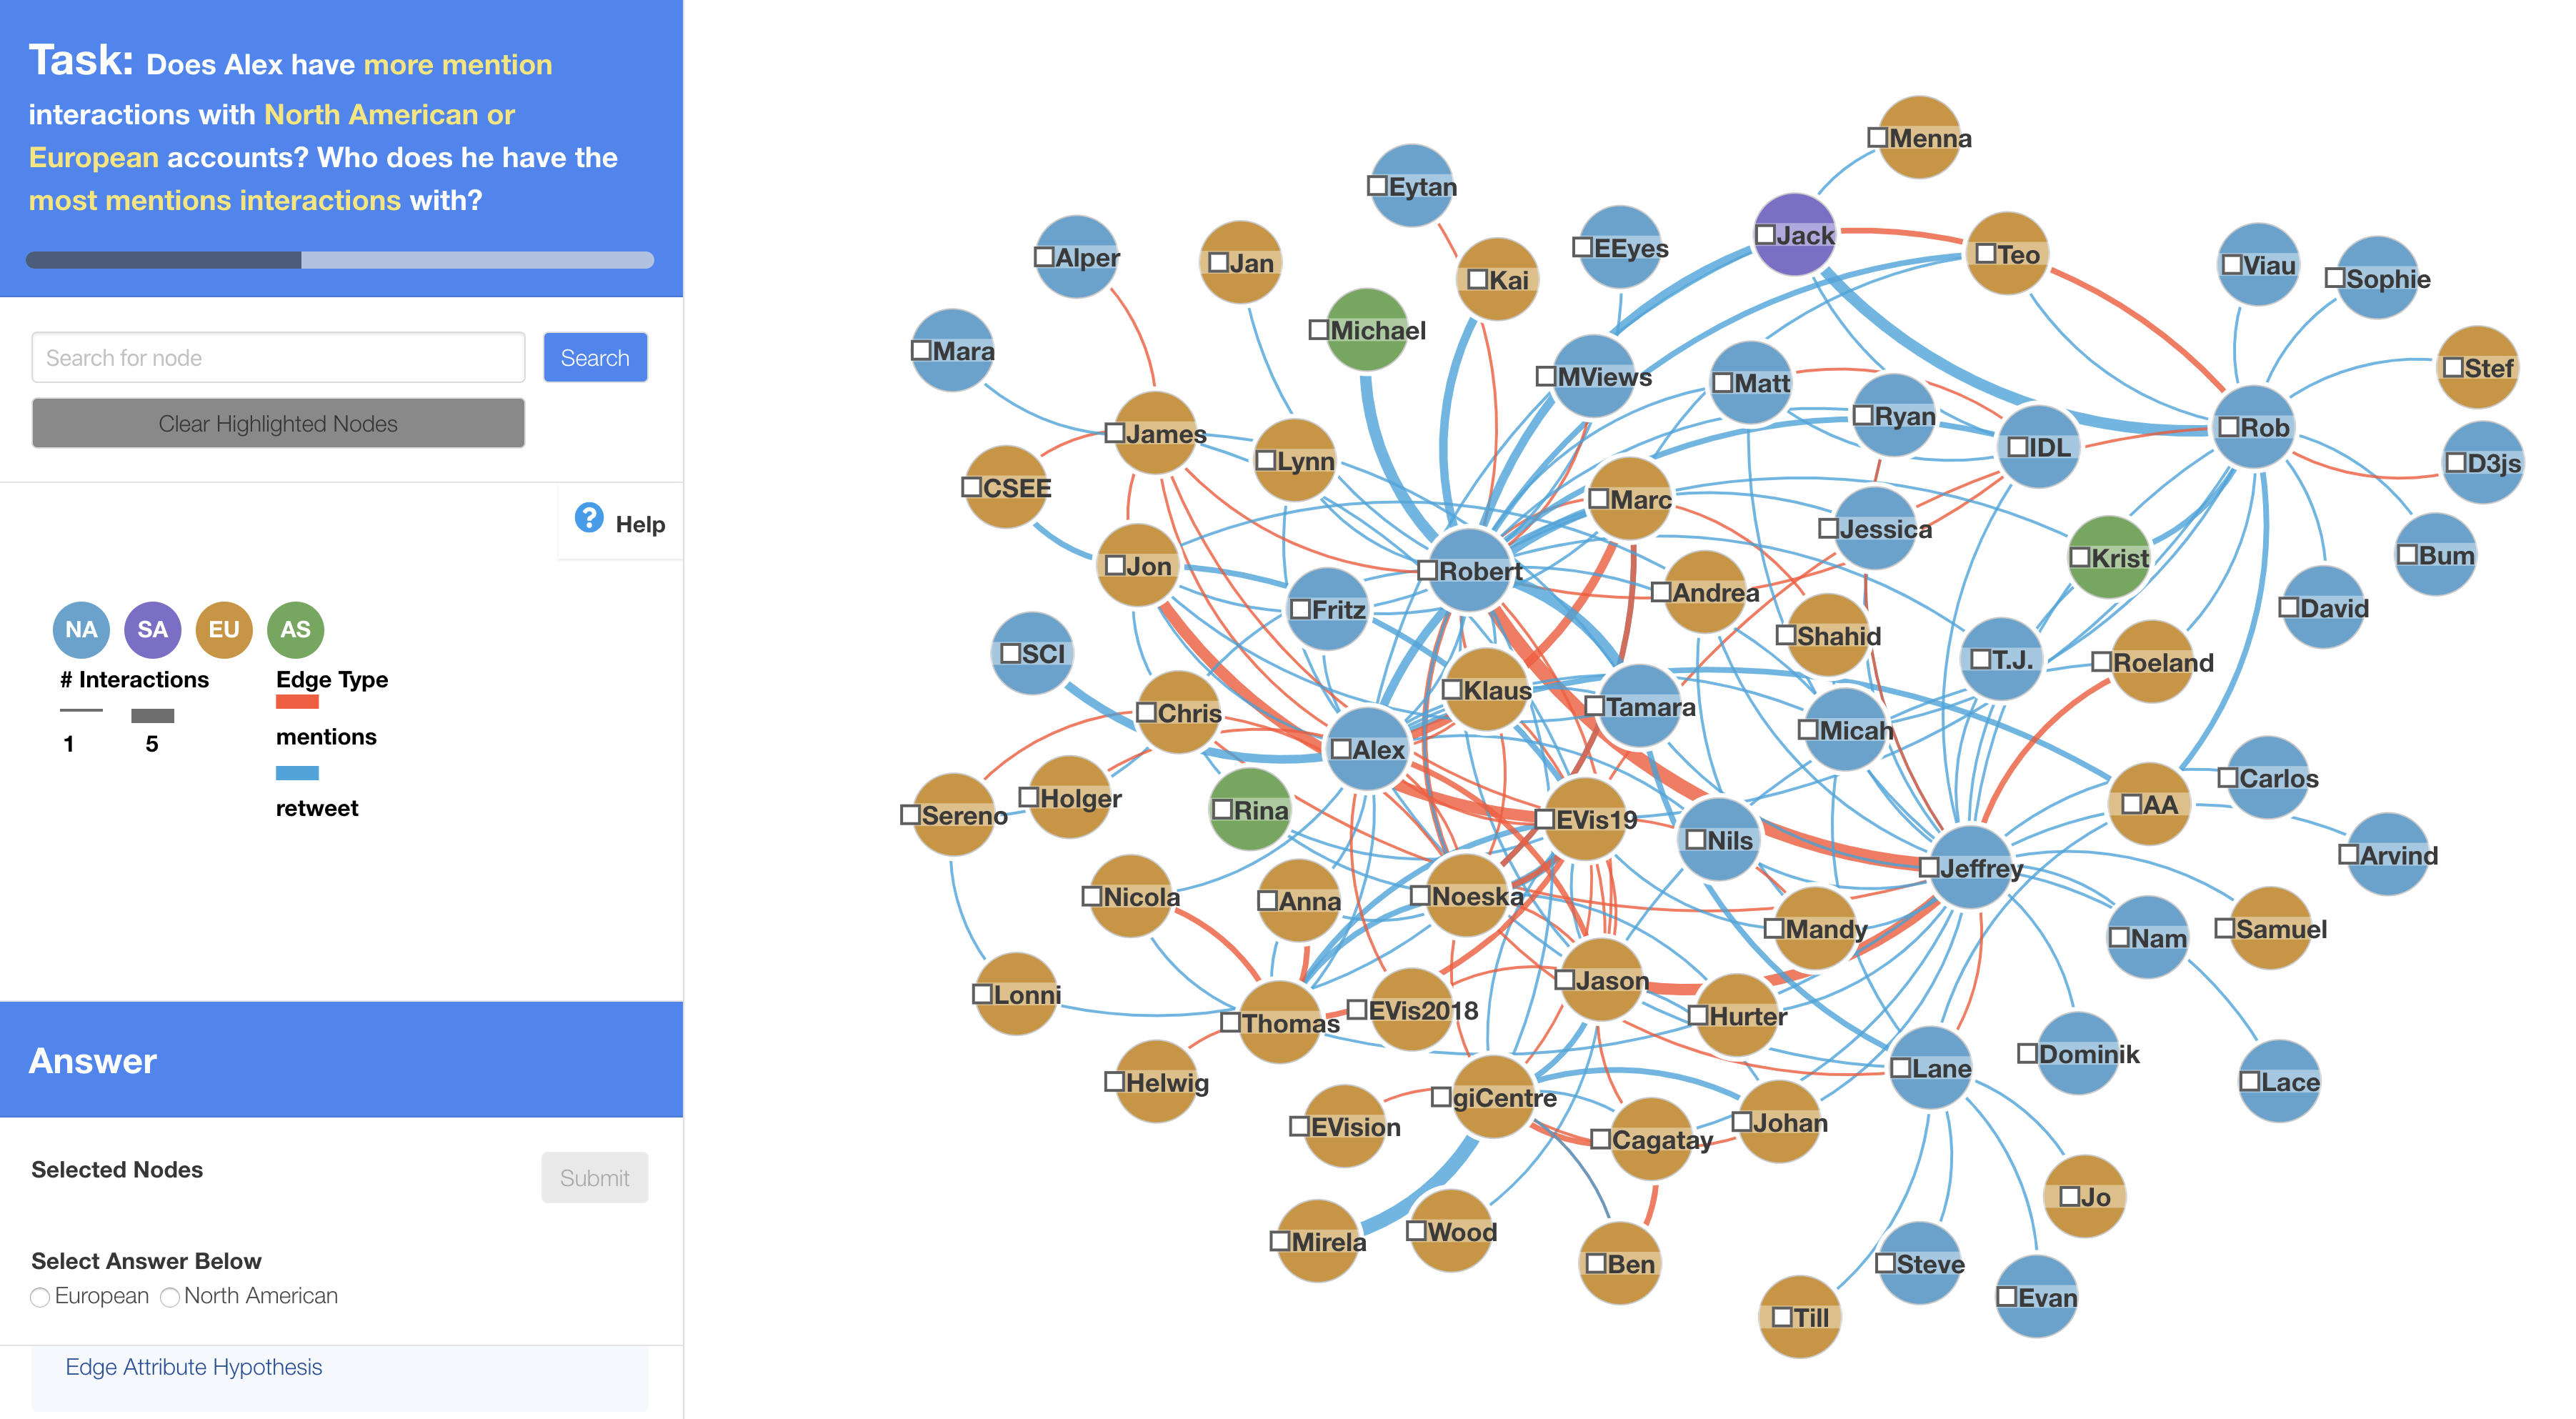
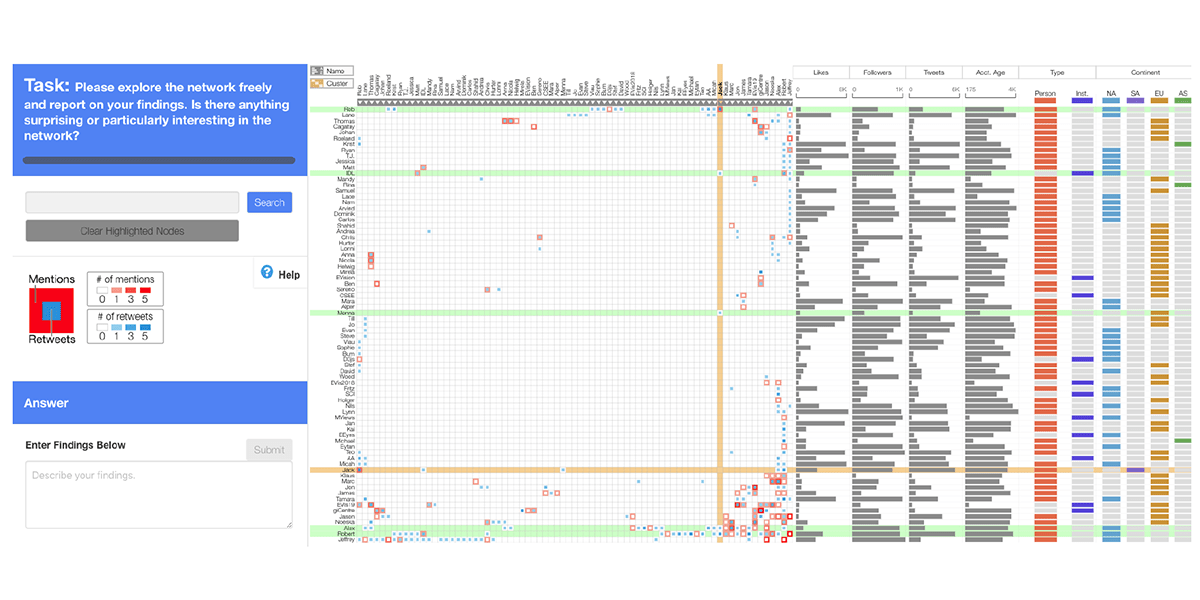
Visualizing multivariate networks is challenging because of the trade-offs necessary for effectively encoding network topology and encoding the attributes associated with nodes and edges. A large number of multivariate network visualization techniques exist, yet there is little empirical guidance on their respective strengths and weaknesses. In this paper, we describe a crowdsourced experiment, comparing node-link diagrams with on-node encoding and adjacency matrices with juxtaposed tables. We find that node-link diagrams are best suited for tasks that require close integration between the network topology and a few attributes. Adjacency matrices perform well for tasks related to clusters and when many attributes need to be considered. We also reflect on our method of using validated designs for empirically evaluating complex, interactive visualizations in a crowdsourced setting. We highlight the importance of training, compensation, and provenance tracking.
Citation
Carolina Nobre,
Dylan Wootton,
Lane Harrison,
Alexander Lex
Evaluating Multivariate Network Visualization Techniques Using a Validated Design and Crowdsourcing Approach
SIGCHI Conference on Human Factors in Computing Systems (CHI), 1-12, doi:10.1145/3313831.3376381, 2020.
BibTeX
@inproceedings{2020_chi_mvnv_study,
  title = {Evaluating Multivariate Network Visualization Techniques Using a Validated Design and Crowdsourcing Approach},
  author = {Carolina Nobre and Dylan Wootton and Lane Harrison and Alexander Lex},
  booktitle = {SIGCHI Conference on Human Factors in Computing Systems (CHI)},
  publisher = {ACM},
  doi = {10.1145/3313831.3376381},
  pages = {1-12},
  year = {2020}
}
Acknowledgements
We thank John Guerra-Gomez for providing the data and the experts who gave feedback on our visualization designs. This work was funded by NSF 1835904 and 1815587.
Images
These images are not part of the original paper and licensed using CC BY 4.0. If you use these images, please cite the paper. Click on the images for full resolution.