Upset 2 as a React Component
UpSet 2.0 is available as a modular React component. Using component configuration and plot configuration objects, many features of UpSet 2.0 can be enabled/disabled as needed.
Installation
npm install @visdesignlab/upset2-react @mui/material@^7.0.0 @mui/system@^7.0.0 @mui/icons-material@^7.0.0 @mui/x-data-grid@^8.0.0 @emotion/react@^11.0.0 @emotion/styled@^11.0.0 recoil@^0.5.0 @trrack/core@^1.3.0-beta.1 @trrack/vis-react@^1.3.0 vega@^5.32.0 vega-lite@^5.2.0 vega-embed@^7.0.2 react-vega@^8.0.0
Note that UpSet 2.0 requires a react version of 18.0 or higher.
Import the component using import { Upset } from @visdesignlab/upset2-react in your react component.
UpSet 2.0 Data
Data structure
The raw data structure for UpSet should be a list of set membership objects.
Raw Data
The data object should be an array of objects. Each object should contain all the set membership boolean values as well as any attributes.
This data example shows only two characters from the Simpsons.
const rawData = [
   {
    "id": 0,
    "Name": "Homer",
    "School": false,
    "Blue Hair": false,
    "Duff Fan": true,
    "Evil": false,
    "Male": true,
    "Power Plant": true,
    "Age": 40
  },
  {
    "id": 1,
    "Name": "Marge",
    "School": false,
    "Blue Hair": true,
    "Duff Fan": false,
    "Evil": false,
    "Male": false,
    "Power Plant": false,
    "Age": 36
  },
]
The data and/or attributes objects can be JSON strings or traditional JS objects.
Loading Data into the UpSet 2.0 component
Loading Raw Data
Data uploaded to UpSet must follow the UpSet 2.0 Data Structure. Simply pass the data object to the Upset component in the data field.
The example below is a simple usecase for loading raw data into UpSet 2.0.
const main = () => {
  const rawData = [
    {
      "id": 0,
      "Name": "Homer",
      "School": false,
      "Blue Hair": false,
      "Duff Fan": true,
      "Evil": false,
      "Male": true,
      "Power Plant": true,
      "Age": 40
    },
    {
      "id": 1,
      "Name": "Marge",
      "School": false,
      "Blue Hair": true,
      "Duff Fan": false,
      "Evil": false,
      "Male": false,
      "Power Plant": false,
      "Age": 36
    },
  ];

  return <Upset data={rawData} />;
}
Pre-Processing Data
If you want to pre-process your data to gain access to the data objects generated and use by UpSet, or are having issues with the raw data loading, you must use the process function from UpSet 2.0 Core. First, import process from @visdesignlab/upset2-react. Then, before loading rendering the UpSet 2.0 component, call the process function, which takes the data and annotations objects as arguments.
The data object should be the same as raw data defined in Data Structure.
The annotations object should be an object with a nested object field columns. This field is a mapping of the column name to the column's data type. The columns field should contain an entry for each possible column in the data, as well as the type for each column.
The entry corresponding to the column which is the name of the item should be of type label. This will be used to generate ids and name the subsets. Note: There should only be one label column. Any entry for a set membership column should be a boolean type. Finally, any entry for an attribute column should be a number type.
In the example below, the item name is Name, noted by the label type. The sets are School, Blue Hair, Duff Fan, Evil, Male, and Power Plant. The only attribute in this dataset is Age, which is a number. This is clear in the annotations object, which denotes this.
const annotations = {
  "columns": {
    "Name": "label",
    "School": "boolean",
    "Blue Hair": "boolean",
    "Duff Fan": "boolean",
    "Evil": "boolean",
    "Male": "boolean",
    "Power Plant": "boolean",
    "Age": "number"
  }
}
The example below details a simple usecase of the process function.
import { Upset } from '@visdesignlab/upset2-react';
import { process } from '@visdesignlab/upset2-core';

const main = () => {
  const rawData = [
    {
      "id": 0,
      "Name": "Homer",
      "School": false,
      "Blue Hair": false,
      "Duff Fan": true,
      "Evil": false,
      "Male": true,
      "Power Plant": true,
      "Age": 40
    },
    {
      "id": 1,
      "Name": "Marge",
      "School": false,
      "Blue Hair": true,
      "Duff Fan": false,
      "Evil": false,
      "Male": false,
      "Power Plant": false,
      "Age": 36
    },
  ];

  const annotations = {
    columns: {
      "Name": "label",
      "School": "boolean",
      "Blue Hair": "boolean",
      "Duff Fan": "boolean",
      "Evil": "boolean",
      "Male": "boolean",
      "Power Plant": "boolean",
      "Age": "number"
    }
  };

  const processedData = process(rawData, annotations);

  return <Upset data={processedData} />;
}
UpSet 2.0 component options
All options
data: The data for the Upset component. See UpSet 2.0 Data for more information.config(optional): The configuration options for the Upset component. This can be partial. See Configuration Options for more details.visualizeAttributes(optional)(string[]): List of attribute names (strings) which should be visualized. Defaults to the first 3 if no value is provided. If an empty list is provided, displays no attributes.visualizeUpsetAttributes(optional)(boolean): Whether or not to visualize UpSet generated attributes (degreeanddeviation). Defaults tofalse.allowAttributeRemoval(optional)(boolean): Whether or not to allow the user to remove attribute columns. This should be enabled only if there is an option within the parent application which allows for attributes to be added after removal. Default attribute removal behavior in UpSet 2.0 is done via context menu on attribute headers. Defaults tofalse.canEditPlotInformation(optional)(boolean): Whether or not the user can edit the plot information in the text descriptions sidebar.hideSettings(optional)(boolean): Hide the aggregations/filter settings sidebar.parentHasHeight(optional)(boolean): Indicates if the parent component has a fixed height. If this is set tofalse, the plot will occupy the full viewport height. When set totrue, the plot will fit entirely within the parent component. Defaults tofalse.extProvenance(optional): External provenance actions and TrrackJS object for provenance history tracking and actions. This should only be used if your tool is using TrrackJS and the Trrack object you provide has all the actions used by UpSet 2.0. Provenance is still tracked if nothing is provided. See App.tsx to see how UpSet 2.0 and Multinet use an external Trrack object. Note that initializeProvenanceTracking and getActions are used to ensure that the provided provenance object is compatible. The provided provenance object must have a type compatible with the extProvenance UpSet 2.0 prop type.provVis(optional): Sidebar options for the provenance visualization sidebar. See Trrack-Vis for more information about Trrack provenance visualization.elementSidebar(optional): Sidebar options for the element visualization sidebar. This sidebar is used for element queries, element selection datatable, and supplemental plot generation.altTextSidebar(optional): Sidebar options for the text description sidebar. This sidebar is used to display the generated text descriptions for an Upset 2.0 plot, given that thegenerateAltTextfunction is provided.footerHeight(optional)(number): Height of the footer overlayed on the upset plot, in px, if one exists. Used to prevent the bottom of the sidebars from overlapping with the footer.generateAltText(optional)(() => Promise<AltText>): Async function which should return a generated AltText object. See Alt Text Generation for more information about Alt Text generation.
Configuration (Grammar) options
The configuration (grammar) is used both as internal tracking for UpSet 2.0, and to generate the alt-text via Multinet's API. Other implementations which are attempting to generate text descriptions using the same API must generate a grammar containing the values below. Reference upset-alt-txt-gen for more information about generating text descriptions.
If no configuration options are provided, the default will be:
- No aggregation
- Sort intersections by
Size - Descending - Sort visible sets by
Alphabetical - Minimum degree filter: 0
- Maximum degree filter: 6
- Show the "no set" intersection
- Hide empty intersections
The configuration options are documented below:
plotInformation: An object which contains meta data abut the plot. The three keys aredescription,sets, anditems. The values should be strings.description: A short description about the dataset. Ex: Movie genres and ratingssets: A very short description of what the sets are in the data. Ex: Movie Genresitems: A very short description of what the items in the data are. Ex: Movies
horizontal: Boolean value describing whether or not the plot is horizontal. Defaults tofalse. Note this value is not used by UpSet 2.0 but may be used to generate text descriptions.firstAggregateBy(string): Describes the first aggregation state. Defaults to"None". Possible values:"None": No first level of aggregation."Sets": Aggregate by which intersections contain each set."Degree": Aggregate by the Degree (set membership count) of the intersections."Deviations": Aggregate by positive and negative deviation."Overlaps": Aggregate by the minimum specified overlap degree.
firstOverlapDegree: Describes the first aggregation's degree of overlap required. This is only used iffirstAggregateByis set toOverlaps. Defaults to2.secondAggregateBy(string): Describes the second (nested) aggregation state. Must be"None"iffirstAggregateByis set to"None". IffirstAggregateByis not"None", this value cannot be the same asfirstAggregateBy. Possible values:"None": No first level of aggregation."Sets": Aggregate by which intersections contain each set."Degree": Aggregate by the Degree (set membership count) of the intersections."Deviations": Aggregate by positive and negative deviation."Overlaps": Aggregate by the minimum specified overlap degree.
secondOverlapDegree: Describes the second aggregation's degree of overlap required. This is only used ifsecondAggregateByis set toOverlaps. Defaults to2.sortVisibleBy(string): Describes the sorting of the visible sets (above the intersection matrix). Defaults to"Alphabetical". Possible values:"Alphabetical": Sort from A - Z. Note Only A - Z sorting is supported."Ascending": Sort based on size, low to high."Descending": Sort based on size, high to low."Set_{Set Name1},Set_{Set Name2}...: Sort based on a custom, comma separated list of set names. Ensure thatSet_is added to each set name. Note All visible sets MUST be present in this list.
sortBy(string): Describes the sorting of the subset intersections. Defaults to"Size". Possible values:"Size": Sorts the plot by the subset size (cardinality) intersections."Degree": Sorts the plot by the degree (set membership) of the intersections."Deviation": Sorts the plot by the calculated deviation. See the original 2014 paper for more information about deviation and how it is calculated.Set_{Set Name}: Sort the plot by Degree (Ascending), but always sort subsets containing the provided set first. For example, a dataset containing movie genres could be sorted bySet_Comedy.Any attribute: Sort the plot by the calculated mean of an attribute value. For example, if the dataset contains an attribute namedReleaseDate, sorting by"ReleaseDate"would use the calculated average release date for the items in the intersections.
sortByOrder(string): The order to sort the plot. This is simply an order indicator, the actual sort type is defined insortBy. Possible values:"Ascending": Sort from low to high"Descending": Sort from high to low"None": This should only be used ifsortBysorts by a set (ex:Set_Comedy). This is because there is only one possible direction for this sorting method.
filters: An object that defines which subsets (rows) are shown in the UpSet plot.maxVisible(number): The maximum degree (set membership count) that a subset can have and still be shown. Defaults to6.minVisible(number): The minimum degree (set membership count) that a subset must have and still be shown. Defaults to0.hideEmpty(boolean): Whether or not to hide empty subset intersections. Defaults totrue.hideNoSet(boolean): Whether or not to hide the subset which is a member of no sets. Defaults tofalse.
visibleSets(string[]): List of which sets are visible and loaded into the UpSet plot. (Ex: ["Set_Comedy", "Set_Drama", "Set_Action"]).visibleAttributes(string[]): List of which attributes are visible and loaded into the UpSet plot. (Ex: ["ReleaseDate", "AvgRating"]).bookmarks: List of which subsets (ids) are bookmarked. Each list entry should be an object with the following key-value pairs:id(string): Generated id for the subset. In UpSet 2.0, the id uses~&~as a set delimiter, and always prependsSubset_. Ex:Subset_Action~&~Adventure~&~Comedylabel(string): Human readable label for the subset. Ex:Action & Adventure & Comedysize(number): The size of the subset.
collapsed(string[]): List of the aggregate intersections which are currently collapsed. (Ex: `["Agg_Degree_1, Agg_Degree_4"]).plots: Object for noting which plots are currently rendered in the element sidebar. Has two fields:scatterplotsandhistograms. Both are lists of the below object. Note This should not be included in your grammar unless it was generated with the UpSet 2.0 interface.- keys:
id(string): Generated id for the plot.type(string): Type of plot. Will always be scatterplot or histogram.x(string): Attribute for the x axisy(string): Attribute for the y axisxScaleLog(boolean): Whether or not to use a logoritihmic scale for the x axis.yScaleLog(boolean): Whether or not to use a logoritihmic scale for the y axis.
- keys:
allSets: List of set objects for every set in the dataset. Each object requires the following fields:name(string): Set id. PrependSet_to the set name. Ex:Set_Action.size(number): The size of the set.
selected: The currently selected intersection. This value should not be populated manually, as the data is specific to UpSet 2.0 and automatically generated.
To export the grammar of an UpSet 2.0 plot programmatically, use the exportState function. This function has the following parameters:
provenance: The Trrack object for the provenance being used by the UpSet plot.data(optional): The raw data used to generated the plot.rows(optional): The processed intersection data generated by the UpSet data pipeline.
Example of full configuration (grammar) JSON produced for default Simpsons dataset:
{
  "plotInformation": {
    "description": "",
    "sets": "",
    "items": ""
  },
  "horizontal": false,
  "firstAggregateBy": "None",
  "firstOverlapDegree": 2,
  "secondAggregateBy": "None",
  "secondOverlapDegree": 2,
  "sortVisibleBy": "Alphabetical",
  "sortBy": "Size",
  "sortByOrder": "Descending",
  "filters": {
    "maxVisible": 6,
    "minVisible": 0,
    "hideEmpty": true,
    "hideNoSet": false
  },
  "visibleSets": [
    "Set_School",
    "Set_Blue Hair",
    "Set_Duff Fan",
    "Set_Evil",
    "Set_Male",
    "Set_Power Plant"
  ],
  "visibleAttributes": [
    "Age"
  ],
  "bookmarks": [],
  "collapsed": [],
  "plots": {
    "scatterplots": [],
    "histograms": []
  },
  "allSets": [
    {
      "name": "Set_School",
      "size": 6
    },
    {
      "name": "Set_Blue Hair",
      "size": 3
    },
    {
      "name": "Set_Duff Fan",
      "size": 6
    },
    {
      "name": "Set_Evil",
      "size": 6
    },
    {
      "name": "Set_Male",
      "size": 18
    },
    {
      "name": "Set_Power Plant",
      "size": 5
    }
  ],
  "selected": null
}
Sidebar options
SidebarProps type:
interface SidebarProps {
  /**
   * Indicates whether the sidebar is open or closed.
   */
  open: boolean;

  /**
   * Callback function to close the sidebar.
   */
  close: () => void;

  /**
   * True if the sidebar is in an embedded application.
   * Disables closing the sidebar & removes top margin.
   */
  embedded?: boolean;
}
Alt Text Generation
Alt Text generation requires the use of a custom or imported Alt-Text generation function. In upset.multinet.app, we are using the Multinet API, which exposes an api call to the upset-alttxt python package.
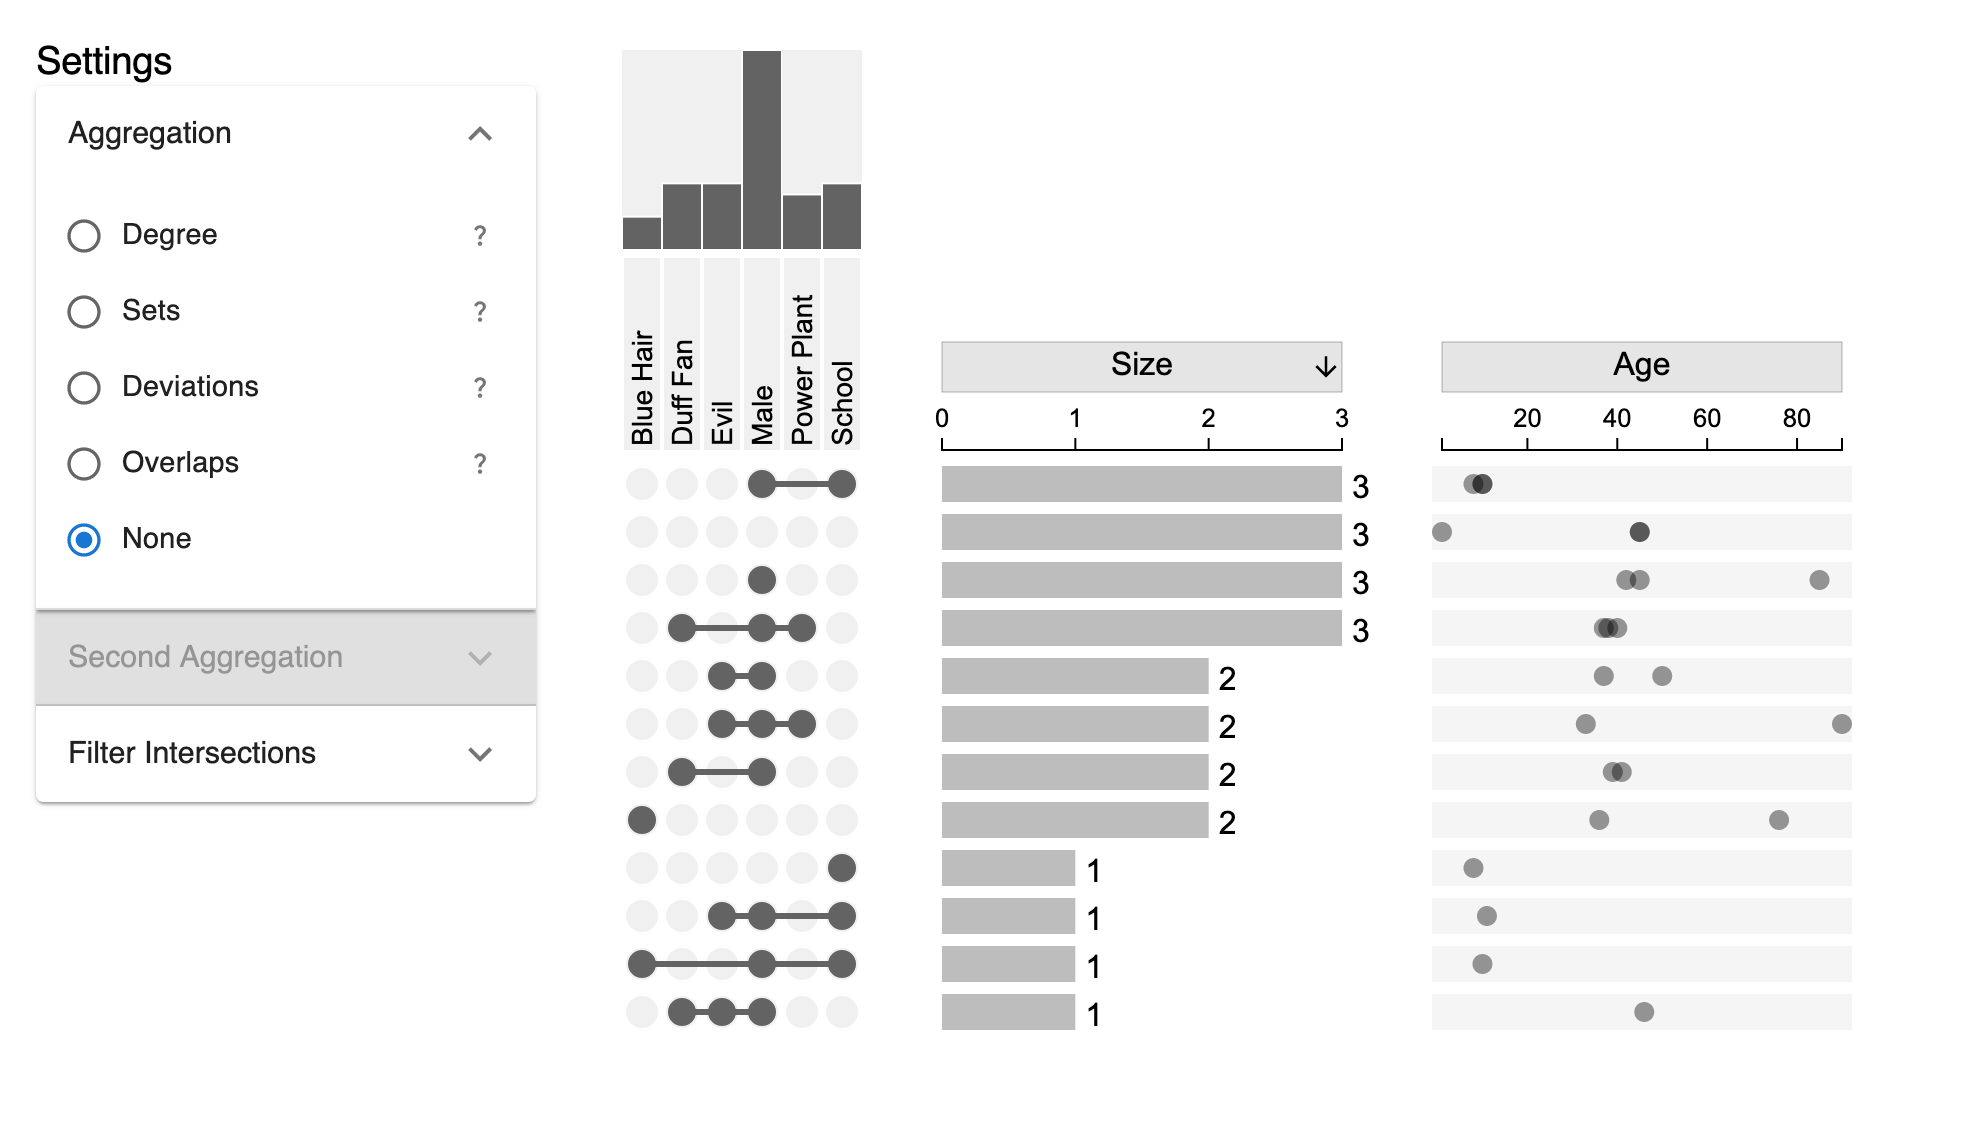
Default Configuration
The default configuration for UpSet 2.0 shows the Aggregation/Filtering settings sidebar, sort the plot by Size (Descending), and shows up to the first 3 attributes in the data.
Example using Simpsons dataset:
<Upset data={simpsonsCharacterData} />