Data Hunches – Recording and Communicating Personal Knowledge in Visualizations


Have you ever looked at data visualization and thought: that doesn't look right. Maybe you knew more about the data than is actually contained in the dataset. Did you then remember that hunch throughout your data analysis process, impacting your judgment and interpretation of the data? That thought, whether you were aware of it or not, possibly impacted your interpretation. Especially if that hunch is based on knowledge you have about the data, it would be useful to externalize that hunch, so others can learn about it and also consider it in their analysis. However, current visualization methods do not support this. In this blog post, we dive into how we came up with data hunches to describe personal knowledge brought to data analysis. We explore methods and designs to record and communicate data hunches through visualizations explicitly.
For the publication, recorded talk video, and prototype for data hunches, please see Data Hunches: Incorporating Personal Knowledge into Visualizations.
The work on data hunches all started when I was working on Sanguine. We built a web interface to visualize blood transfusion data for the University of Utah Hospital. After the iterative design and implementation process, we presented the tool to surgeons and anesthesiologists. We received positive feedback on the innovative interface, but the surgeons were doubtful about something they saw: they suspected that some of the data was inaccurately reflecting their practices. One indicator of good transfusion practices is recovering blood lost during the surgery and re-infusing it back. . Our interface showed a significant number of cases where blood was not recycled. The surgeons, however, stated that they turned on the machine for almost all surgeries and suspected that this was not always entered correctly in the patient chart. At the time, we were only able to record this artifact through textual annotation and email exchange, but it was very limited. The surgeons could not articulate how, in their opinion, the visualization should look to reflect their practice.
We realized that we had seen this pattern before in our lab. In that case, global health experts had knowledge about how countries reported Zika cases differently. For example, Expert A knew that Country X only reports cases of pregnant women in their first-trimester, while Expert B knew that Country Y reports all suspected and confirmed cases. Such knowledge was not represented in the data or the visualization, but the knowledge impacted their analysis. As an attempt to explicitly record experts’ knowledge, our colleagues incorporated structured forms to let the health experts record their knowledge in the visualization so that it could be shared with others.
This must be recorded somewhere, right?
We dug into uncertainty literature, expecting to find an appropriate definition and method to deal with what we saw in these projects. What we found instead, however, are varied and inconsistent definitions of uncertainty. For example, Hullman refers to uncertainty as “the possibility that the observed data or model predictions could take on a set of possible values”, whereas Bonneau and colleagues state that “uncertainty is the lack of information.” Most of the uncertainty research focuses on how uncertainty is unknown. Instead, we wanted to capture things that are known, but not part of the dataset.
 Analysts should have the tools to record and communicate their knowledge.
And here is where data hunches come into play
If we keep using the term uncertainty to describe everything and anything unknown from an unsituated perspective, agnostic to who does not know the data, we will continue to ignore the deep and expansive knowledge that experts bring to their visual analysis sessions. Instead, we introduce the term data hunch to define and highlight the importance of the personal knowledge of experts. The definition we used in our publication goes, an analyst’s knowledge about how and why the data is an imperfect and partial representation of the phenomena of interest. It can be used to record knowledge about something big in scope, as when countries use different approaches to report Zika cases. Or, it can be narrow, only applying to a subset of a dataset. For example, in the figure below, the COVID cases reported in Utah showed two dips during the holiday season. But based on our knowledge about COVID testing reporting, it is likely that fewer tests were conducted, and some agencies might not have reported them during the holiday season.
 NYTimes COVID dashboard of UT cases.
How can we record and communicate data hunches?
Based on this idea, we can start to explore the possible ways of explicitly recording and communicating data hunches. We want the process to be intuitive and direct, with tools like annotations, drawings, and direct manipulations. We explored many visual channels and marks to annotate data hunches. In the end, we decided to use similar marks and channels to the original visualization to keep things simple. This way, we can have the best chance of keeping data hunches close to the data and similar to the original visualization.
To demonstrate how a user can record their data hunches in visualization, we built a prototype for visualizing bar charts with three data sets to choose from: student research area data, greenhouse gas related to food production data, and COVID case data of selected countries. We implemented an array of techniques, such as direct manipulation, graphical annotation, and direct input. Feel free to play with the prototype and add your own hunches!
 The prototype interface with a few data hunches added.
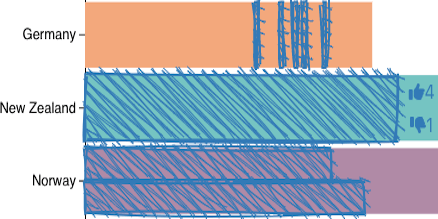
With this prototype, we wanted to make it clear that the data hunch is recorded by a human, and not collected or modeled. To do this, we chose to show data hunches using sketchyness and a handwritten font to show the text related to a hunch. With data hunches on visualizations, users not only get a visual representation of their internal mental model, but also have an easier time collaborating with their colleagues.
 Adding a data hunch in our prototype through direct manipulation. The prototype also allows upvoting/downvoting
We are excited about the design possibility that data hunches can bring to the visualization research community. We hope to open up new design opportunities by recognizing data hunches, but there are also some issues and ethical considerations. Do data hunches reinforce biases? Can there be potential harm in using data hunches? And how do data hunches impact trust in visualizations? For more details about data hunches, design guidelines, and a discussion of the challenges, please refer to the paper.
The Paper
This blog post is based on the following paper:
Data Hunches: Incorporating Personal Knowledge into Visualizations
IEEE Transactions on Visualization and Computer Graphics (VIS), 2022