Abstract
This project furthers progress in our understanding of data visualization by developing infrastructure to allow researchers to conduct feature-rich online experiments. Data visualizations are crucial in data driven discovery in fields as diverse as medicine, biology, or intelligence. Visualization is also often used in communication, for example by newspapers or government agencies. However, it is difficult to know which visualization techniques are better for particular datasets and tasks. Can certain visualization techniques enable people to make judgements more efficiently, or more correctly? Does a particular technique lead to more insights, or to more diverse types of insights than others? Is one technique more enjoyable to use, or more versatile? Is one technique easier to learn than another one? Is a technique better after developing familiarity? These are the kinds of questions that the visualization community needs to answer to develop a rigorous understanding of data visualization. Having answers to these questions will allow us to make better visualization design choices, develop better recommendations for visualizations, and allow us to tailor visualizations to audiences and situations. This project will develop testing infrastructure, so that scientists can ask these questions efficiently in large scale web-based experiments, with diverse participants that reflect the intended audience of visualizations. The team will develop the reVISit Infrastructure, a suite of modular but compatible tools to design and debug online studies of interactive visualization techniques, to efficiently design training material for the study, to elicit free-form, spoken responses from participants, and to provide advanced tools for analyzing such data.
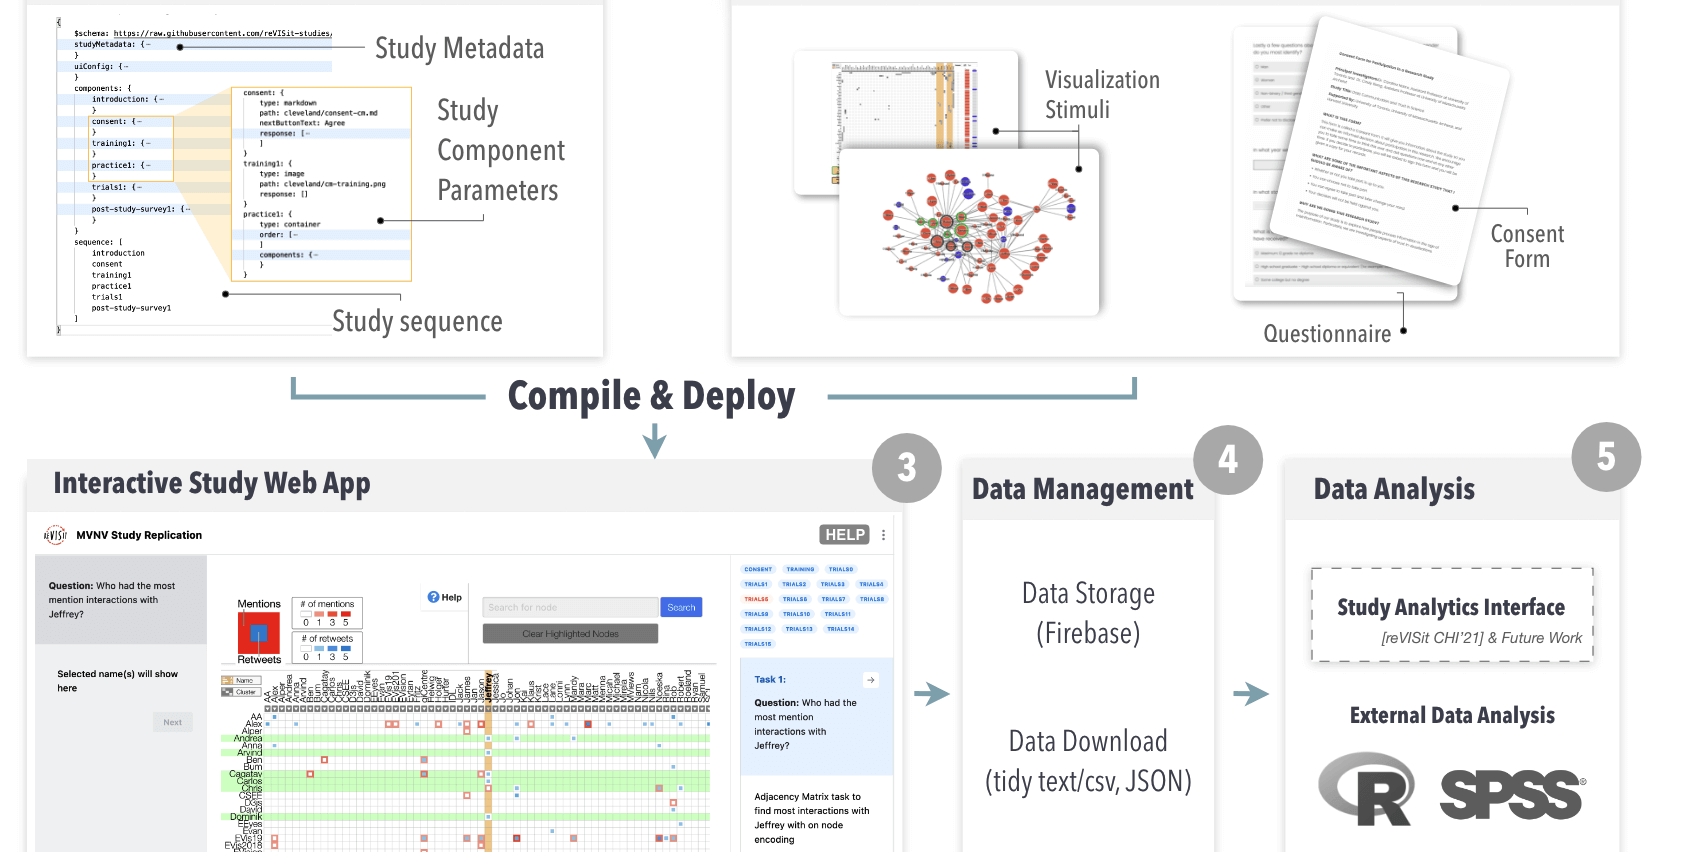
The proposed reVISit infrastructure development addresses a critical bottleneck in visualization research: how can we better and more efficiently empirically evaluate visualization techniques? The reVISit infrastructure aims to democratize evaluation of interactive visualization techniques, an area that has been under-explored, due in part to the high technical burden and skills required to create complex online experiments. The key innovations of this project are: (1) Software infrastructure for flexible study creation and instrumented data collection, including interaction provenance, insights, and rationales, compatible with online crowdsourced study contexts. (2) Software infrastructure to wrangle the results data into formats compatible with off-the-shelf analysis tools, and advanced software infrastructure to analyze these diverse data streams that can be used for piloting, quality control, and analyzing usage types, insights, rational, and performance. These methods will allow visualization researchers to gather empirical evidence about the merits of different interactive visualization techniques. It will allow researchers to understand the types of insights that different techniques support, revealing diverging analysis strategies users may take. Ultimately, these methods will enable a wider set of visualization researchers to run a much broader range of experiments using crowdsourcing than before.
Publications
reVISit: Looking Under the Hood of Interactive Visualization Studies
SIGCHI Conference on Human Factors in Computing Systems (CHI), 2021
reVISit: Supporting Scalable Evaluation of Interactive Visualizations
IEEE Visualization and Visual Analytics (VIS), 2023
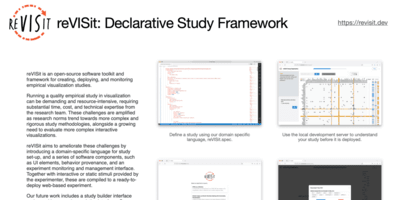
ReVISit: Declarative Study Framework
NSF CIRC PI Meeting, 2023
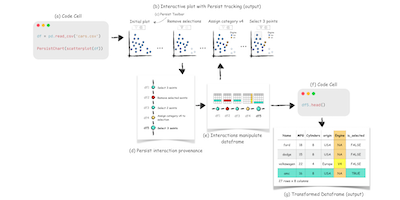
Persist: Persistent and Reusable Interactions in Computational Notebooks
Computer Graphics Forum (EuroVis), 2024