reVISit: Taking Control of Your Online Studies!

Today we’re announcing the release of reVISit version 1.0, our open platform for designing, debugging, publishing, and disseminating your online visualization user studies!
You might have heard of reVISit before from our paper, or you might have seen a talk or participated in a meetup. But as of today, we’re excited to give the community a chance to run your own studies with reVISit with our 1.0 release – and CHI is just around the corner!
What is reVISit?
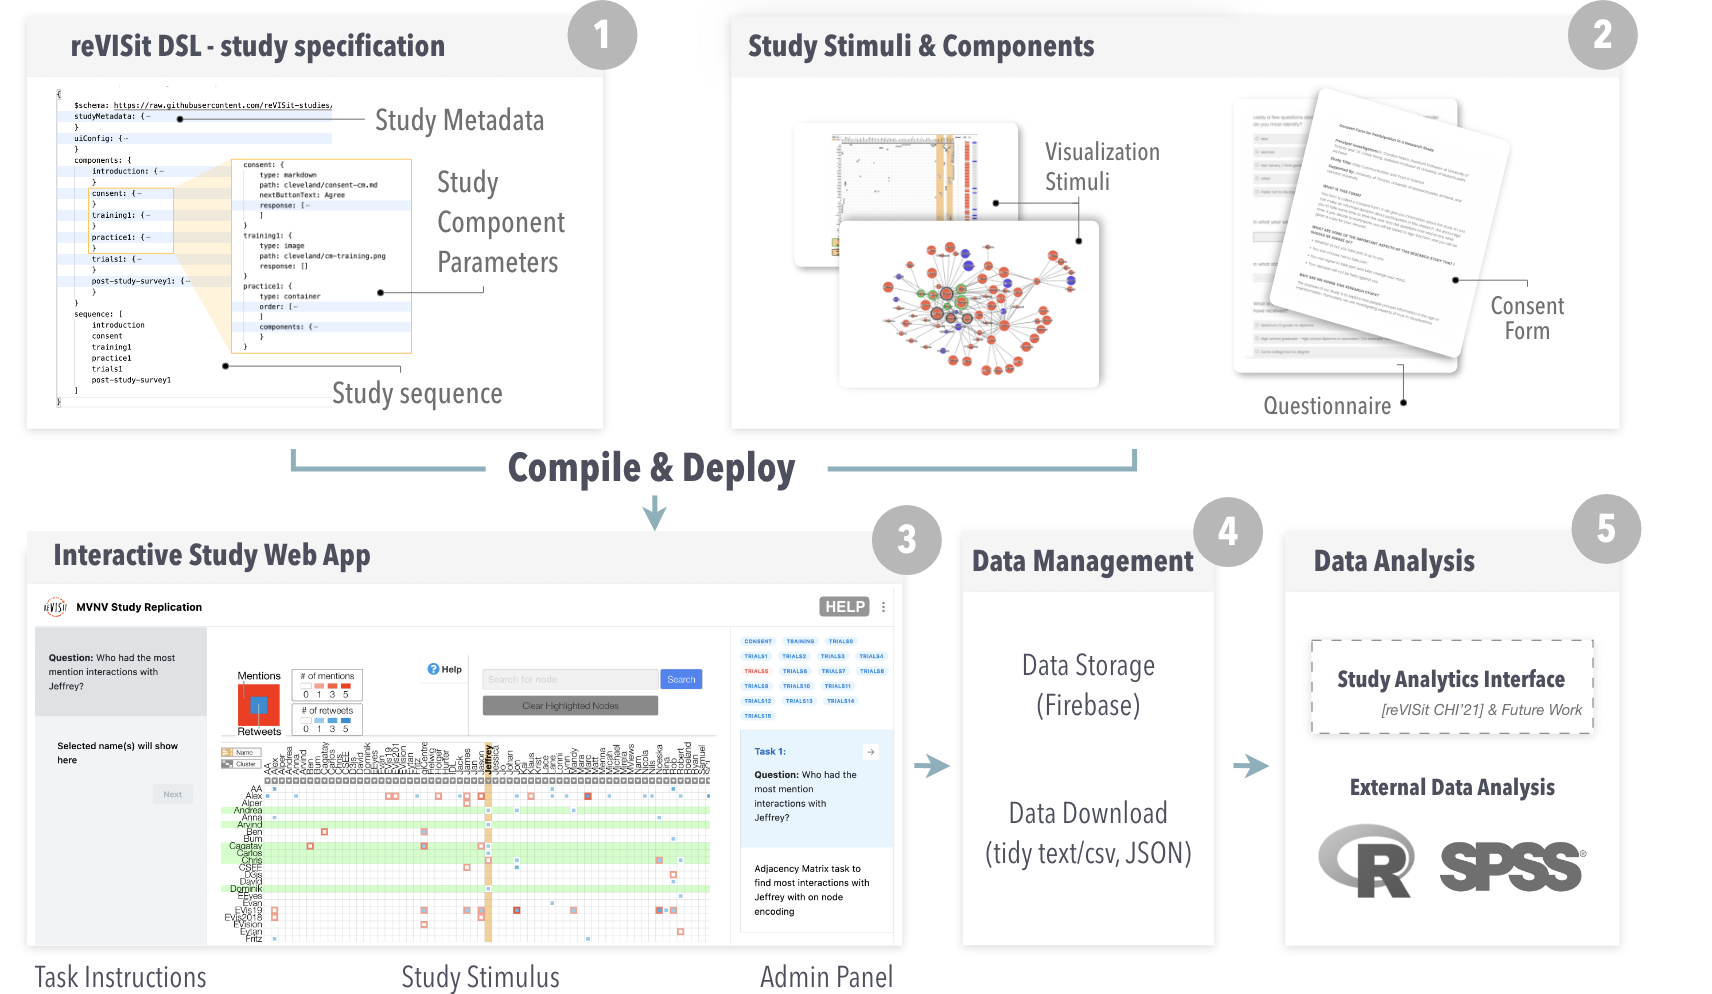
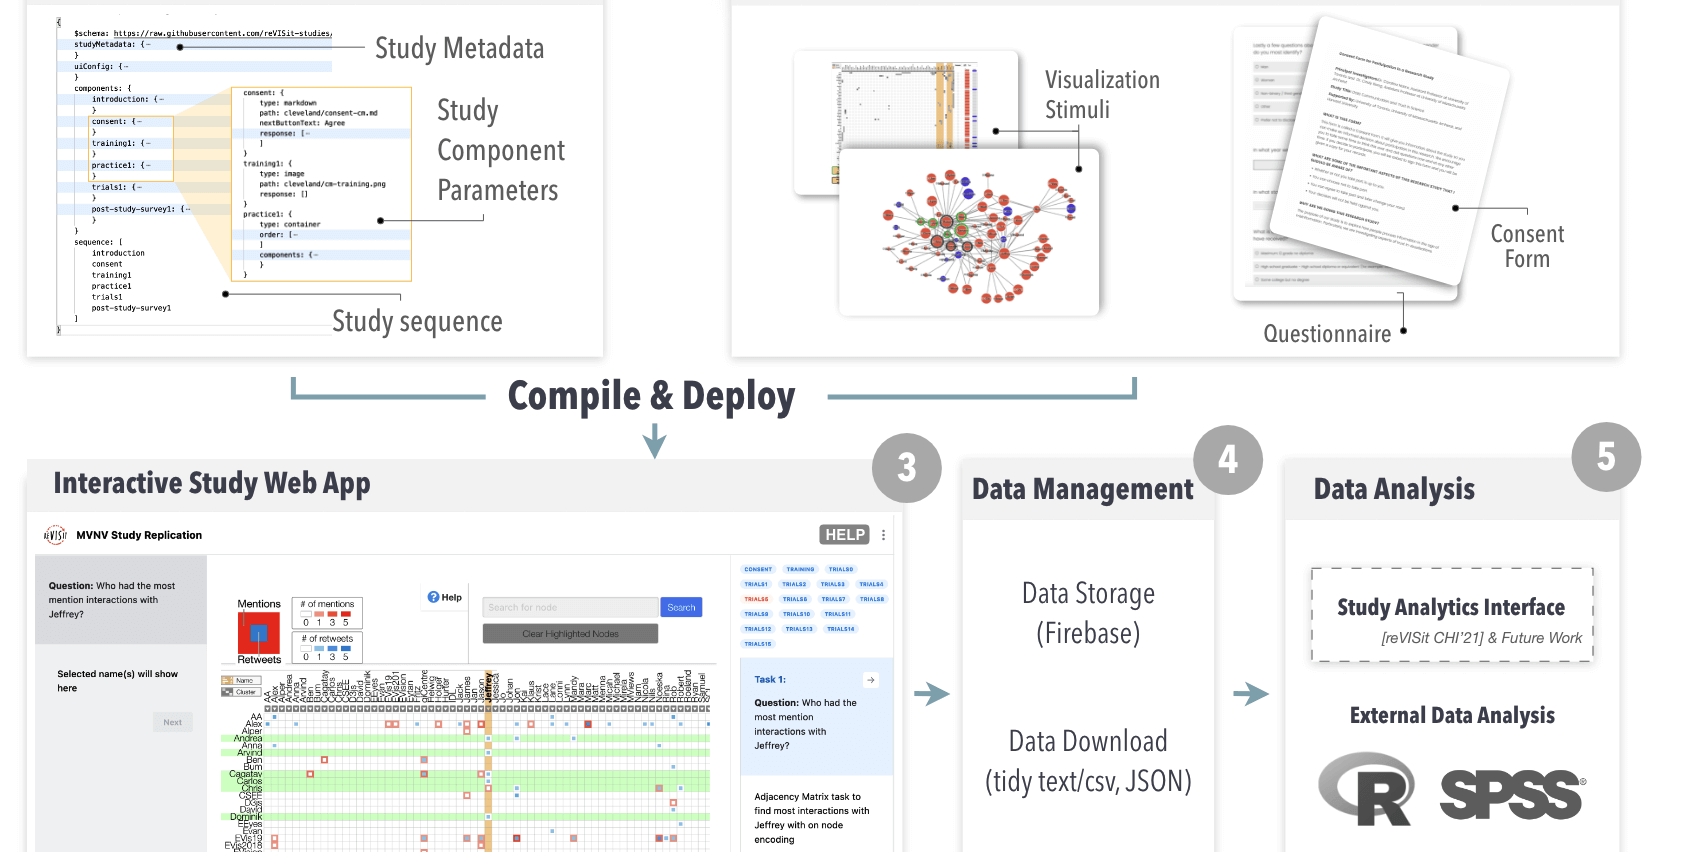
ReVISit is a software framework that enables you to assemble experimental stimuli and survey questions into an online user study. One of the biggest time-saving features of ReVISit is a JSON grammar, the reVISit Spec, used to describe the setup of your study. Stimuli are contained in components and can be either markdown, images, web pages, React components, or survey questions. The figure at the top shows the relationship of the reVISit Spec, the components, and how they are then compiled into a study.
Due to the different types of components, you can use reVISit for a diverse set of studies, spanning simple surveys, image-based perceptual experiments, and experiments evaluating complex interactive visualizations.
ReVISit is designed to accommodate sophisticated stimuli and study designs. Suppose you want to replicate the seminal Cleveland and McGill study. With reVISit you could implement a React-based set of visualizations (a bar chart, a stacked bar chart, a pie chart), and then pass parameters, such as the data, and the markers to highlight the marks, all via the study configuration.
Similarly, the reVISit spec enables designers to create controlled sequences defining in which order participants see stimuli. reVISit supports fixed, random, and Latin square designs that can be nested at various levels. For example, the overall study sequence (intro, training, experiment, survey) could be fixed. In the experiment arm, two conditions could use a Latin-square design. Within each condition, the experiment could randomly draw a small number of stimuli from a large stimuli pool while interspersing attention checks at random points and adding breaks.
Assembling and Deploying your Study
The components and your study configuration are then used to assemble a web-based study. You can first look at your study on your local browser, and if you want to share it deploy it to the web server of your choice. We recommend and document deploying to GitHub pages, but any web server you have access to will do.
You can then use the online version to direct participants to your study. You can use crowdsourcing platforms such as Prolific, Mechanical Turk or LabintheWild, or you can simply send a link to participants that you have recruited in other ways.
Data Collection
A typical study will have response fields, such as a text field or a slider, to provide the response. Such form-based responses are tracked by reVISit by default and can be downloaded in either JSON or a tidy tabular format. Similarly, you can provide response data out of interactive stimuli. For example, if a task is to click on a specific bar in a bar chart, you can log which bars were clicked. ReVISit tracks a diverse set of browser window events such as mouse moves, clicks, scrolls, resizes, which are time-stamped and can hence be used for basic log file analysis.
ReVISit also supports advanced provenance tracking based on trrack a provenance tracking library developed at our lab. If you instrument your study stimuli with trrack, you can recreate every state of your interface of every single participant! This can be incredibly useful to understand nuances of user behavior, as well as to help you debug your stimuli by exploring what went wrong in a particular session. In a future release, reVISit will also allow you to dynamically browse these events and fully “re-hydrate” all participants experiments.
Data Storage
ReVISit is implemented as a (mostly) server-less application, meaning that you don’t have to run, secure, and maintain a server to use reVISit. The only exception to this is data storage, as obviously, the data of online participants has to be stored somewhere.
If you’re running a local study, you can get away without this – you can just download the data from your browser after a study is complete. For online studies, we use Google Firebase to store data.
Currently, setting up Firebase for a reVISit study might be the most challenging part of working with reVISit. On the plus side, Firebase is a tried-and-true system where you have full control over your data. You even have options to choose the locale of your server so that you are compliant with your country’s regulations on data storage.
Data Analysis
ReVISit is not meant to replace your usual data analysis approaches. Instead, it aims to make it easy to export data in the formats you might use in R, Python, or your analysis platform of choice.
ReVISit, however, does provide a basic analytics interface that is most useful for monitoring the progress of your study. You can also use reVISit to identify participants that didn’t appropriately complete the study and reject them, which is most useful if you want to ensure that you have appropriate numbers of participants in your Latin square design.
What are the Benefits of Using reVISit?
So, why would you use reVISit over other approaches to running your study, such as Qualtrics, Survey Monkey, or even a custom experiment interface?
First, reVISit is open source with all the benefits you have of using open source software: it’s free; you can extend it; you can contribute to improving it.
Second, the open source nature and our approach of forking reVISit for your own study and storing your data in your own Firebase means that you have full control over your study and the data. Once you have forked the study, it will remain accessible and unchanged for as long as you like.
Third, reVISit has dedicated modes for quickly navigating your study, and you can also turn off data collection. This is great for both, developing your study, but also sharing your study with reviewers and readers of your research. That means that readers can see exactly what your participants saw, and hence may trust your study more. They could also fork your study and run a replication of your study with minimal effort! You can check out an example study and the associated results.
I’m Intrigued, but Can I Trust it for my Experiment?
reVISit is new, and we know that it’s fraught to bet on a new project if you don’t know whether it actually works or whether it will be maintained down the line. But we hope we can convince you to trust us!
First, we currently have multiple years of funding to continue development of reVISit. We’ve also ourselves run several successful studies, such as a study on guardrails against misinformation. Finally, we are committed to help you out if you run into issues! Join our slack team to get low-friction help, or write to us at contact@revisit.dev. We’re also happy to set up a meeting to answer any questions you may have; for example, to talk us through whether reVISit will work for your study design.
How Can I Learn More or Get Involved?
We’re grateful to all the community members who have shared their study needs and helped to make ReVISit 1.0 a reality, and we’re looking forward to bringing the community exciting new features in the coming year. Future releases will include better debugging tools through study rehydration, a way to capture and code think-aloud data, and improved analysis capabilities. Depending on community feedback we’re also interested in branching out to unconventional display devices (phones, AR/VR, etc.)
To take your first steps with reVISit, check out our getting started guide for instructions on how to install our software and to build a study.
Finally, if you are missing a feature or find a bug, let us know! Since reVISit is completely open source you could even submit a pull request!
Acknowledgements
We are very grateful to everyone who helped make reVISit a reality, including our wonderful community advisory board and the National Science Foundation for generous funding.
The Paper
This blog post is based on the following paper:
reVISit: Supporting Scalable Evaluation of Interactive Visualizations
IEEE Visualization and Visual Analytics (VIS), 2023