Abstract
The Utah Population Database (UPDB) and the Utah Genome Project have curated one of the world’s largest and richest resources on genetic, demographic, and clinical data backed by unique genealogical records. This data is leveraged to study a wide variety of diseases, including cancer and psychiatric conditions. One challenge that researchers face when using this data is its complexity and heterogeneity: researchers need to integrate family structures, genetic data, clinical course and/or co-occurring conditions, demographic variables, environmental exposures, and many other data types to gain insights that will lead more swiftly to genetic discovery. Often times, this integration is attempted using algorithmic or statistical methods, which can be a difficult and long process. In this project, we will develop sophisticated data visualization methods tailored to the integrated analysis of data from the Utah Genome Project and the Utah Population Database to complement statistical and algorithmic methods. These visual data analysis methods will leverage both, the power of computation and the unique abilities of humans to interpret large and complex datasets. Our methods and tools will speed up discovery and enable a wide range of researchers without computational training to perform such analysis.
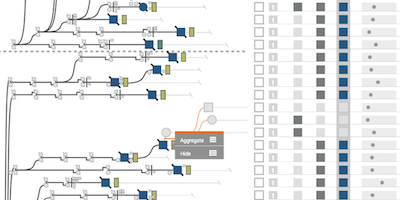
We have recently developed Lineage, a prototype for visualizing large families with significantly increased incidence of suicide. Lineage is the first scalable genealogy visualization tool that can also show rich demographic and clinical data about the individuals in families. Our tool allows us to interactively understand common characteristics of suicide cases and their familial relationships at the same time. In this project, we will develop Lineage into a visualization resource that is of high utility to the whole community of researchers that use Utah Genome Project and Utah Population Database data. The key steps to achieve this goal are (a) the integration of genetic data into Lineage, (b) the ability to cluster cases across families, and (c) the addition of import and export capabilities, so that researchers can employ the tool with their own datasets without assistance.
Publications

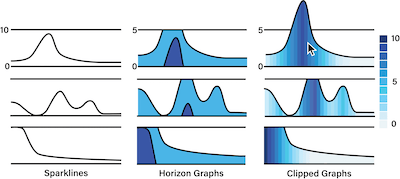
Clipped Graphs: A Compact Time-Series Encoding
Proceedings of the IEEE Information Visualization Conference – Posters (InfoVis), 2019

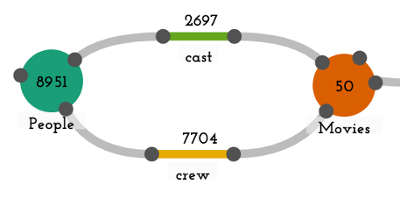
Origraph: Interactive Network Wrangling
IEEE Conference on Visual Analytics Science and Technology (VAST), 2019

Lineage: Visualizing Multivariate Clinical Data in Genealogy Graphs
IEEE Transactions on Visualization and Computer Graphics, 2019


