Histogram
Histograms take all values for a particular attribute (from elements in visible intersections), sort them into bins, then display how many elements fall into each bin. The number of bins is defined while creating the histogram and defaults to 20.

For example, in this histogram of movie watches, we can see that there are over 2,000 movies with watch counts between 0 and 200, with the number of movies in each bin falling drastically as watch counts increase.
Colored Bars
When intersections are bookmarked or selected, the number of elements from each intersection that fit into a given bar are displayed as a stacked bar chart. Each stacked bar is given the bookmark color of the intersection that it represents.
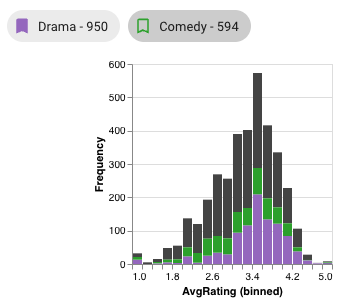
In this example, two intersections have colors, so two extra bars appear in this histogram. From these bars, we can see that elements (movies) in the Comedy intersection generally matches the rating trend of the overall dataset (in grey), whereas there are few or no elements in the Drama intersection with ratings between 2.2 and 2.4. Additionally, it's clear from the relative heights of the stacked bars that Comedy has less elements in most bars than Drama, which makes sense, as Comedy is the smaller intersection overall.
Selections
Graphical selections add their own bars to histograms; see Histogram Selection. Element queries do not affect element view plots.