Kernel Density Estimate (KDE)
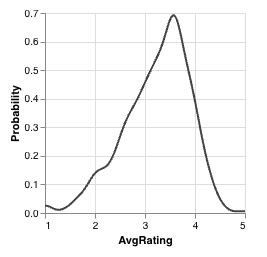
Kernel Density Estimate Plots (also known as density plots or KDEs) show the probability density function for a given attribute. These plots use all attribute values from elements in visible intersections to produce a kernel density estimate for this attribute.
Colored Density Estimates
When intersections are selected or bookmarked, additional colored lines are added to each KDE for each selected/bookmarked intersection. These lines represent a density estimate of attribute values exclusively from elements in the corresponding intersection.
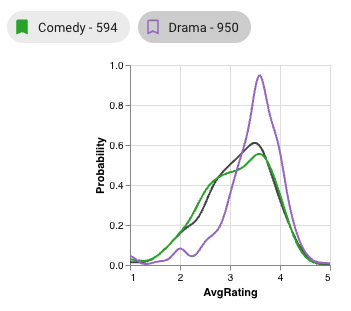
In this example, two intersections have colors, so two extra density lines appear in the plot. From these lines, we can see that elements (movies) from the Drama intersection are much more likely to ratings between 3 and 4, whereas elements from the Comedy intersection are more evenly distributed and better match the overall dataset (in grey).
Selections
Graphical selections add an additional line to KDEs; see KDE Selections. Element queries do not affect element view plots.