Publications
Peer-reviewed Journal and Conference Publications

Zach Cutler,
Jack Wilburn,
Hilson Shrestha,
Yiren Ding,
Brian Bollen,
Khandaker Abrar Nadib,
Tingying He,
Andrew McNutt,
Lane Harrison,
Alexander Lex
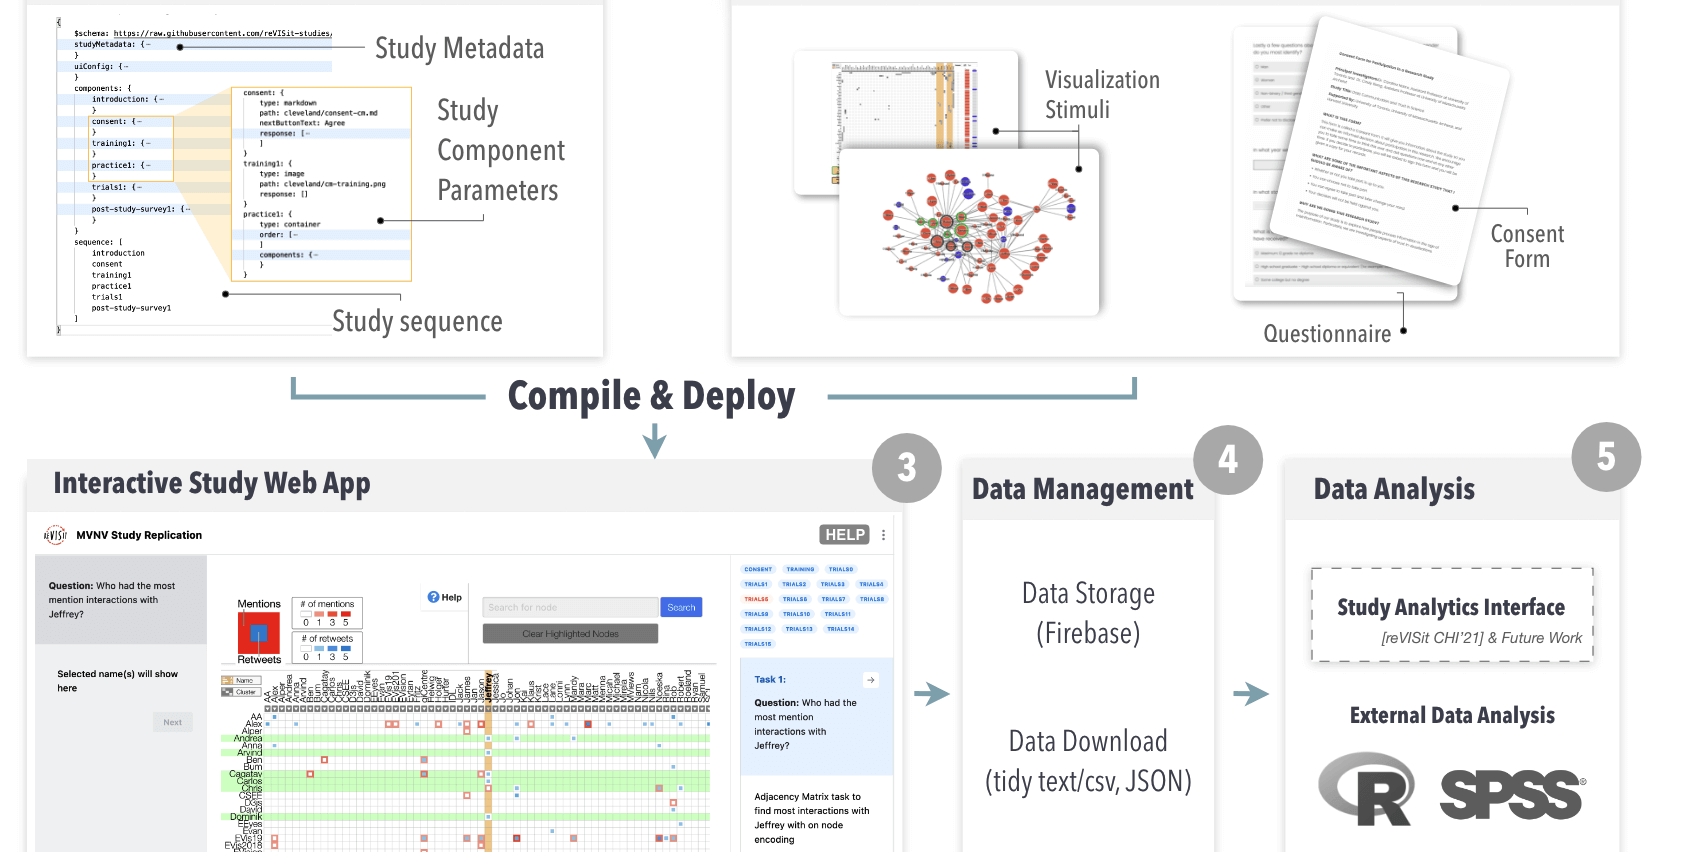
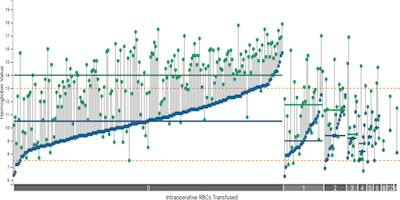
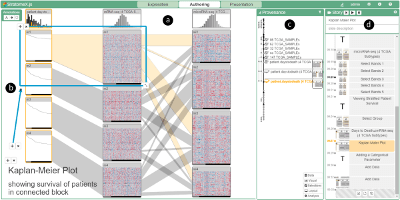
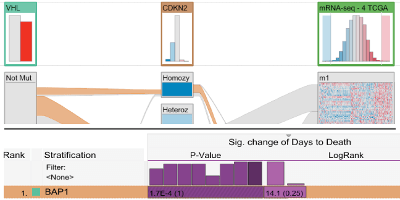
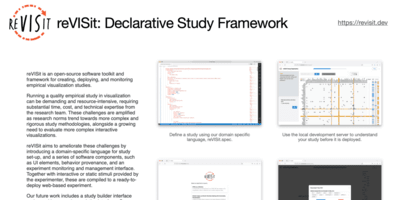
ReVISit 2: A Full Experiment Life Cycle User Study Framework
IEEE Transactions on Visualization and Computer Graphics (VIS), 2026
IEEE VIS 2025 Best Paper Award
Commentary
Thesis
Selected Posters
Funded Research Projects
Talks
Keynote Talks
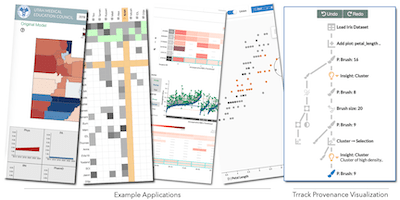
Provenance as a Bridge Between Data Analysis Modalities
Key |
PDF
Visualization in Data Science: Challenges and Opportunities
Key |
PDF
Celebrating 30 Years of ICG, Graz University of Technology, Graz, Austria, 2023-06-12
Spatial Omics Visualizations: Lessons Learned from Networks and Maps
Key |
PDF
BioVis@VIS, IEEE VIS, New Orleans, USA (virtual), 2021-10-25.
Opportunities for Understanding Semantics of User Interactions
Key |
PDF
What is Data Visualization and Why Do We Care About it for Biomedical Applications?
Key |
PDF
May Institute, Computation and statistics for mass spectrometry and proteomics, Northeastern University, Boston, MA, USA, 2019-05-06.
Invited Talks
reVISit: A Toolking for Data Visualization Experiments
Key |
PDF
Georgia Tech, Atlanta, GA, USA 2025-01-13.
The reVISit User Study Platform and Applications in Studying Misinformation
Key |
PDF
MIT CSAIL HCI Seminar, Cambridge, MA, USA 2024-12-13.
A Hodgepodge of Visualization Research: Provenance, User Studies, Misinformation
Key |
PDF
Department of Informatics Colloquium, University of Zürich, Zürich, Switzerland, 2024-10-03.
Media and Information Technology (MIT) Seminar, Linköping University, Norrköping, Sweden, 2024-06-03.
Visualization in Oncological Data Science Now and in the Future: From Cancer Cell Microscopy to Reproducible Visual Analysis
Key |
PDF
Oncological Data Science Symposium, ODSi, Huntsman Cancer Institute, Utah, 2023-02-28
Empirical Evaluation of Complex Interactive Visualization Techniques
Video |
Key |
PDF
SCI VIS Seminar, University of Utah, USA, 2022-08-31.
Institute for Computer Graphics, TU Wien, Vienna, Austria, 2022-06-03.
Literate Visualization: Making Visual Analysis Sessions Reproducible and Reusable
Video |
Key |
PDF
Visualization Summer School of Zhejiang University, China (virtual), 2022-07-07.
VRVis Zentrum für Virtual Reality und Visualisierung, Vienna, Austria, 2022-03-24.
Graz University of Technology, Graz, Austria, 2021-11-11.
Séminaire LIRIS, CNRS / INSA Lyon / Université Lyon 1 & 2 / École Centrale de Lyon, Lyon, France, 2021-10-18.
Visualization of Biological Data - From Analysis to Communication, Dagstuhl Seminar, Schloss Dagstuhl, Germany, 2021-10-04.
Datavisyn Public Lecture Series, datavisyn, Linz, Austria, 2021-07-02.
ICG Lab Talk, Johannes Kepler University, Linz, Austria, 2021-06-15.
Departmental Seminar, Department of Computer Science, City University London, London, UK (virtual), 2020-11-17.
Goldman Sachs Tech Expo, Salt Lake City, UT, USA, 2020-07-24.
Utah Center for Data Science Seminar, Salt Lake City, UT, USA, 2020-01-06.
Spatial Omics Visualizations: Lessons Learned from Networks and Maps
Key |
PDF
Worcester Polytechnic Institute, BCB Seminar Series, 2021-12-09.
Driving Scientific Discovery with Interactive Visual Data Analysis
Key |
PDF
Department of Computer Science, University of Copenhagen, Denmark, 2021-10-04
Institute for Science and Technology (IST) Austria, Klosterneuburg, Austria, 2020-02-25.
A Framework for Creative Visualization-Opportunities Workshops
PDF
NIH-NCI Workshop on Accelerating Cancer Research through User-Centered Software Design, Washington, DC, USA, 2019-01-07.
Enabling Scientific Discovery through Interactive Visual Data Analysis
Key |
PDF
Adobe, Lehi, UT, USA, 2019-04-10.
Lucid Software, Salt Lake City, UT, USA, 2019-03-12.
Goldman Sachs Tech Expo, Salt Lake City, UT, USA, 2017-06-28.
Department Of Biomedical Informatics, University of Utah, Salt Lake City, UT, USA, 2017-04-06.
Walmart, Tech Tuesday, Bentonville, AK, USA, 2017-02-07.
Marth Lab, Department of Human Genetics, University of Utah, Salt Lake City, UT, USA, 2016-08-25.
Pacific Northwest National Laboratory, Richland, WA, USA, 2016-07-01.
Huntsman Cancer Institute, Salt Lake City, UT, USA, 2016-03-30.
Camp Lab, Huntsman Cancer Institute, University of Utah, Salt Lake City, UT, USA, 2015-11-23.
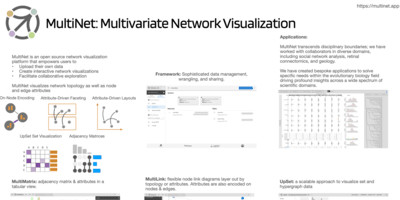
Layout Adaption Strategies for Visualizing Multivariate Networks
Key |
PDF
University of Calgary, Calgary, AB, Canada, 2018-06-18.
Lineage: Visualizing Multivariate Clinical Data in Genealogy Graphs
Key |
PDF
NIH-NCI Workshop on Accelerating Cancer Research through User-Centered Software Design, Washington, DC, USA, 2019-01-07.
Genome Rounds, University of Utah, SLC, UT, USA, 2018-08-24.
Department of Psychiatry, University of Utah, SLC, UT, USA, 2018-06-05.
BioIT World Conference & Expo, Boston, MA, USA, 2018-05-17.
Harvard John A. Paulson School of Engineering and Applied Sciences, Harvard University, Cambridge, MA, USA, 2018-05-16.
Visualizing Biological Data: Pathway Graphs, Genealogies, and Alternative Splicing
Key |
PDF
Helmholtz Diabetes Center, Munich, Germany, 2018-10-29.
Translational Genomics Research Institute (TGen), Phoenix, AZ, USA, 2018-08-14.
Association for Molecular Pathology (AMP) Annual Meeting, Salt Lake City, UT, USA, 2017-11-17.
Merck Research Laboratories, Boston, MA, USA, 2017-06-15.
Department Of Biomedical Informatics, Harvard Medical School, Boston, MA, USA, 2017-06-14.
Enabling Scientific Discovery through Interactive Visual Data Analysis
PPT |
PDF
University of Vienna, Vienna, Austria, 2015-08-07.
Adobe Research, San Francisco, CA, USA, 2015-04-06.
EPFL, Lausanne, Switzerland, 2015-03-26.
University of Utah, Salt Lake City, UT, USA, 2014-12-03.
University of St. Andrews, St. Andrews, Scotland, 2014-11-03.
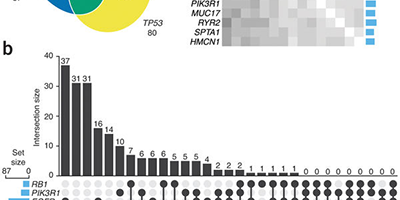
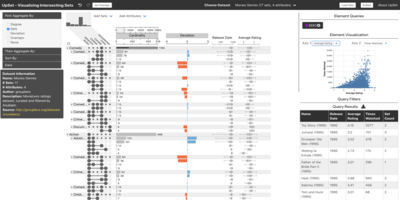
UpSet: Visualization of Intersecting Sets
PPT |
PDF
Data Ventures, Harvard University, Cambridge, MA, USA, 2015-04-23.
BioIT World Conference & Expo, Boston, MA, USA, 2015-04-22.
Tufts University, Sommerville, MA, USA, 2014-10-29.
Visual Data Analysis for Biology and Pharmacology
PPT |
PDF
PerkinElmer, Boston, MA, USA, 2014-11-05.
Novartis Institutes for BioMedical Research, Cambridge, MA, USA, 2014-07-09.
Visualizing Relationships between Biological Pathways
PPT |
PDF
Drug Discovery on Target Conference, Boston, MA, USA, 2014-10-08.
BioIT World Conference & Expo, Boston, MA, USA, 2014-05-01.
DBMI, Harvard Medical School, Boston, MA, USA, 2014-04-17.
Visualization Approaches for Biomolecular Data
PPT |
PDF
Georgia Tech, School of Interactive Computing, Atlanta, GA, USA, 2014-04-08.
University of Calgary, Department of Computer Science, Calgary, AB, Canada, 2014-02-13.
MIT CSAIL, Cambridge, MA, USA. 2013-04-12.
UMass Lowell, Lowell, MA, USA, 2013-11-06.
Visualizing Multi-Attribute Rankings & A Very Short Visualization Introduction
PPT |
PDF
Harvard Graduate School of Education, Strategic Data Project, Cambridge, MA, USA, 2014-03-07.
Data Visualization in Molecular Biology
PPT |
PDF
Novartis Institutes for BioMedical Research, Cambridge, MA, USA, 2013-07-29.
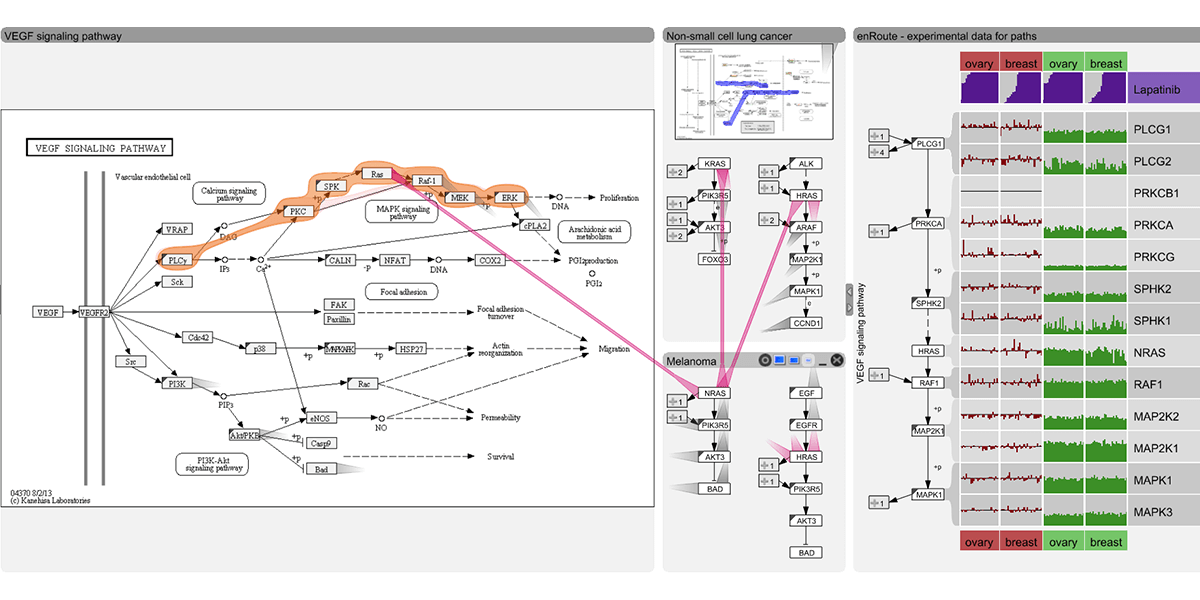
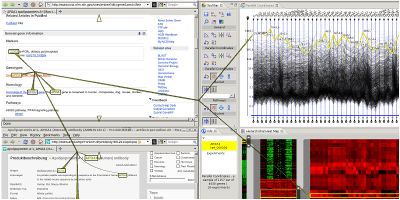
enRoute: Dynamic Path Extraction from Biological Pathway Maps for Exploring Heterogeneous Experimental Datasets
PPT |
PDF
BioIT World Conference & Expo, Boston, MA, USA, 2013-04-10.
Visualizing Biological Data (VIZBI) 2013, Cambridge, MA, USA, 2013-03-20.
Symposium on Understanding Cancer Genomics through Information Visualization at Tokyo University, Tokyo, Japan, 2013-02-22.
Visualizing Biomolecular Data with the Caleydo Framework
PDF
CBMI, Harvard Medical School, Boston, MA, USA, 2011-08-12.
MRC Laboratory of Molecular Biology (LMB), Cambridge, UK, 2010-09-21.
European BioInformatics Institute (EBI), Cambridge, UK, 2010-09-20.
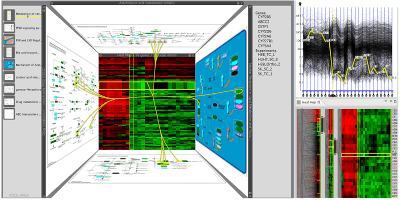
Caleydo: Visual Analysis of Biomolecular Data
VCBM 2010 Leipzig, Germany, 2010-07-02.
Caleydo and Visual Links
VRVis Research Company, Vienna, Austria. 2010-03-11.
Caleydo: Visualization of Gene Expression Data in the Context of Biological Processes
AUVA Research Center for Traumatology, Vienna, Austria, 2009-02-26.
Novel InfoVis Techniques Applied to Pathways and Gene Expression Data
Institute for Genomics and Bioinformatics, Graz University of Technology, Austria, 2008-07-10.
Paper Presentations
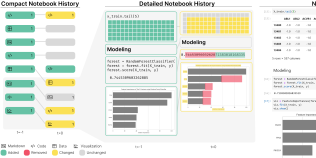
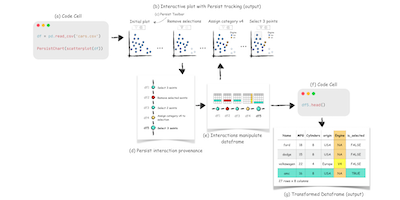
Persist: Persistent and Reusable Interactions in Computational Notebooks
Key |
PDF
EuroVis Conference, Odense, Denmark, 2024-05-29
Pathfinder: Visualizing Paths in Graphs
Key |
PDF
BioVis @ ISMB, Orlando, FL, USA, 2016-07-08.
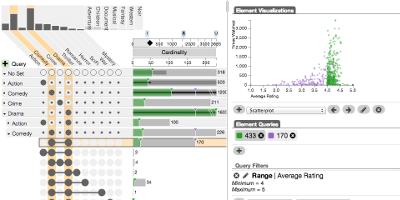
UpSet: Visualization of Intersecting Sets
PPT |
PDF
IEEE InfoVis, Paris, France, 2014-11-03.
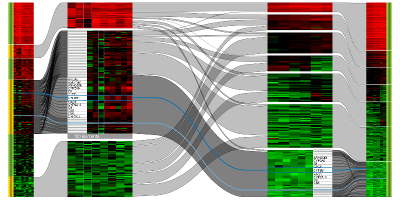
StratomeX: Visual Analysis of Large-Scale Heterogeneous Genomics Data for Cancer Subtype Characterization
PDF
IEEE BioVis 2012, Seattle, Washington, USA, 2012-10-14.
EuroVis 2012, Vienna, Austria, 2012-06-07.
VisBricks: Multiform Visualization of Large, Inhomogeneous Data
PDF
IEEE InfoVis 2011, Providence, Rhode Island, USA, 2011-10-26.
Visualizing the Effects of Logically Combined Filters
PDF
Information Visualization 2011, London, UK. 2011-07-14.
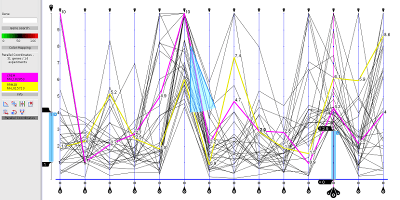
Comparative Analysis of Multidimensional, Quantitative Data
PDF
IEEE InfoVis 2010, Salt Lake City, Utah, USA. Paper presentation, 2010-10-28.
Caleydo: Design and Evaluation of a Visual Analysis Framework for Gene Expression Data in its Biological Context
PacificVis 2010, Taipei, Taiwan. 2010-03-03.
Tutorials
Visualizing Multivariate Networks
Key |
PDF
Carolina Nobre, Marc Streit, and Alexander Lex
Companion Website
IEEE VIS 2019, Vancouver, BC, Canada, 2019-10-20.
StratomeX & enRoute: Integrative Visualization with Caleydo
Nils Gehlenborg and Alexander Lex
Cancer Data Analysis with Caleydo StratomeX and enRoute
PPT |
PDF
Alexander Lex and Marc Streit
Symposium on Understanding Cancer Genomics through Information Visualization, Tokyo University, Tokyo, Japan, 2013-02-22.
Connecting the Dots – Showing Relationships in Data and Beyond
PPT |
PDF
Marc Streit, Hans-Jörg Schulz, and Alexander Lex
Handout & References
VisWeek’12, Seattle, WA, USA, 2012-10.
Panels
Is the need for systems hindering the development of Visual Analytics?
Ethics, Reviewing and Discussion Culture at VIS
How Can We Ensure Fair Pay for Study Participants?
Visualization Response in a Time of Pandemic
Teaching
Current PhD Students
Maxim Lisnic, PhD '25
Zach Cutler
| Visualization tools, Provenance, Storytelling
Ishrat Jahan Eliza
Khandaker Abrar Nadib
| Human Centered Computing, Visualization, Applied Data Science
Graduated PhD Students
Devin Lange
| Cell Microscopy Visualization, Cancer Cell Visualization, Identifying Falsification in Scientific Data
Kiran Gadhave, PhD '24
Haihan Lin, PhD '23, Now at Lucid Software
Jen Rogers, PhD '22, Now PostDoc at Tufts University
Carolina Nobre, PhD '20, Now Faculty at the University of Toronto
Christian Partl, PhD '18 (co-advised with Dieter Schmalstieg)
Current Undergraduate Students
Zoe Exelbert, BS '25
Luke Schreiber
| Data Visualization, Health Science
Former Students
Sunny Siu, BS/MS '21
Shaurya Sahai, MS '21
Zach Cutler
| Visualization tools, Provenance, Storytelling
Pranav Rajan, B.S.'21
Hannah Bruns, BS '20
Max Marno, PhD rotation '20
Ilkin Safarli
Sai Varun, MS '20
Dylan Wootton, BS '19, Now PhD student at MIT
Shuvrajit Mukherjee
T Cameron Waller
Pranav Dommata, MS '18
Sahar Mehrpour, PhD rotation '17
Mengjiao Han, PhD rotation '17
Asmaa Aljuhani, PhD rotation '17
Annie Cherkaev, PhD rotation '17
Sunny Hardasani, MS '16
Anirudh Narasimhamurthy, MS '16
Michael Kern, MS '16
Murali Krishna Teja Kilari, MS '17
Sateesh Tata, MS '16
Roy Bastien, BS '16
Priyanka Parekh, BS '16
Shreya Singh, MS '15
Varsha Alangar, MS '15
Rasvan Iliescu, MS '14
Alain Ibrahim, MS '14
Tamar Rucham, MS '14
Gabriel Hase, MS '14
Conor Myhrvold, MS '14
Ran Sofia Hou, BS '13 (co-advised with Joe Blitzstein)
Thomas Geymayer, MS '12, BS '11 (with D. Schmalstieg)
Christian Partl, MS '12 (with D. Schmalstieg)
Michael Lafer, BS '10 (with D. Schmalstieg)
Hannes Plank, BS '11 (with D. Schmalstieg)
Jürgen Pillhofer, MS '10 (with D. Schmalstieg)
Michael Wittmayer, BS '09 (with D. Schmalstieg)
Helmut Pichlhöfer, BS '10 (with D. Schmalstieg)
Oliver Pimas, BS '10 (with D. Schmalstieg)
Bernhard Schlegl, MS '09 (with D. Schmalstieg)
Werner Puff, MS '10 (with D. Schmalstieg)
Christian Partl, BS '09 (with D. Schmalstieg)
Stefan Sauer, BS '09 (with D. Schmalstieg)
Courses
Applied Data Visualization | COMP 5960
Fall 2023, Fall 2024
https://www.dataviscourse.net/2023-applied/
Professional Development | CS 4011
Spring 2024
Human Centered Data Analysis | CS 6957
Spring 2023
Visualization for Data Science | CS 5630 / CS 6630
Fall 2022, Fall 2020, Fall 2019, Fall 2018, Fall 2017, Fall 2016, Fall 2015
http://dataviscourse.net
Introduction to Data Science | COMP 5360 / MATH 4100
Spring 2018, Spring 2019, Spring 2020, Spring 2021
http://datasciencecourse.net
Co-Instructor: Braxton Osting
Introduction to Data Science | CS 5963 / MATH 3900
Fall 2016
http://datasciencecourse.net
Co-Instructor: Braxton Osting
Visualization Seminar | CS 7942
Spring 2018, Fall 2017, Spring 2017, Fall 2016
Visualization | CS 171 (Harvard)
Spring 2015
http://www.cs171.org/2015/
BioVis | (JKU Linz)
Spring 2013
Selected Topics Computer Graphics | (TU Graz)
Fall 2010, Fall 2011, Fall 2012
Press
SCI Insitute & @TheU, 2024
NSF-Funded Team Launches reVISit – Pioneering Open-Source Software for Visualization Research
Inside Science, 2017
How Math Can Help Geologists Discover New Minerals
The OpenHelix Blog, 2016
Video Tip of the Week: Pathfinder, for exploring paths through data sets
The OpenHelix Blog, 2014
Video Tip of the Week: UpSet about genomics Venn Diagrams?
The Harvard Crimson, 2014
Painting by the Numbers: Data Visualization
The Harvard Crimson, 2014
New Tool Makes Cancer Analysis More Accessible
Harvard Medical School News, 2014
Pattern Recognition: New visualization software uncovers cancer subtypes
GenomeWeb, 2014
Harvard TCGA Data Visualization Software Adds Tools to Better Characterize Disease Subtypes
The OpenHelix Blog, 2014
StratomeX for genomic stratification of diseases
Harvard SEAS News & Harvard Gazette, 2014
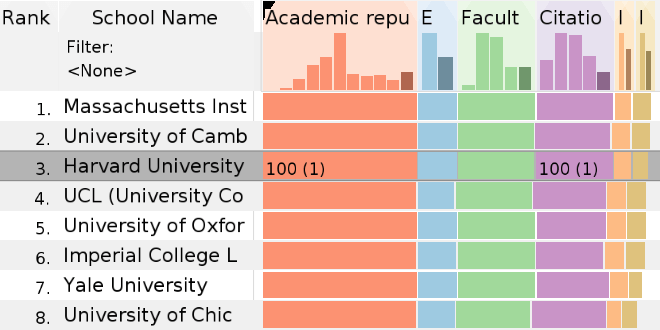
What's behind a #1 ranking?
Forbes, 2014
Harvard And DARPA Develop Software For Deconstructing Top 100 Rankings
Der Standard, 2014
Heimische Forscher machen die Dynamik hinter Rankings sichtbar
The OpenHelix Blog, 2014
Video Tip of the Week: Entourage and enRoute from the Caleydo team
Nature Methods, 2013
Data visualization: ambiguity as a fellow traveler
GEN - Genetic Engineering & Biotechnology News, 2013
Pathway Analysis to Decipher Data
Harvard SEAS News, 2013
Celebrating minds dedicated to discovery
The OpenHelix Blog, 2010
Tip of the Week: Caleydo for gene expression and pathway visualization