Peer-Reviewed Journal and Conference Papers

ReVISit 2: A Full Experiment Life Cycle User Study Framework
IEEE Transactions on Visualization and Computer Graphics (VIS), 2026
IEEE VIS 2025 Best Paper Award

Here’s what you need to know about my data: Exploring Expert Knowledge’s Role in Data Analysis
IEEE Transactions on Visualization and Computer Graphics (VIS), 2026
IEEE VIS 2025 Honorable Mention Award

Using Tactile Charts to Support Comprehension and Learning of Complex Visualizations for Blind and Low-Vision Individuals
IEEE Transactions on Visualization and Computer Graphics (VIS), 2026

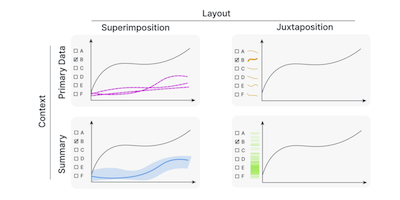
Reframing Pattern: A Comprehensive Approach to a Composite Visual Variable
IEEE Transactions on Visualization and Computer Graphics (VIS), 2026

A Comprehensive Evaluation of Life Sciences Data Resources Reveals Significant Accessibility Barriers
Scientific Reports, 2025
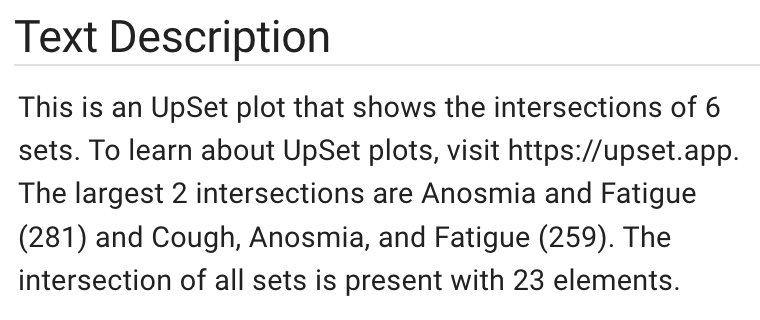
Accessible Text Descriptions for UpSet Plots
Computer Graphics Forum (EuroVis), 2025
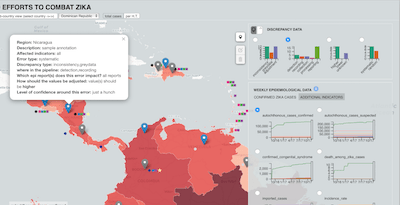
Visualization Guardrails: Designing Interventions Against Cherry-Picking in Interactive Data Explorers
SIGCHI Conference on Human Factors in Computing Systems (CHI), 2025
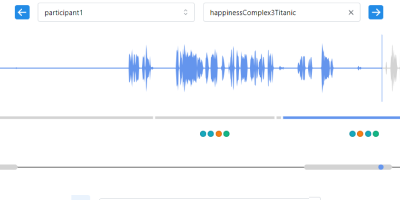
Crowdsourced Think-Aloud Studies
SIGCHI Conference on Human Factors in Computing Systems (CHI), 2025
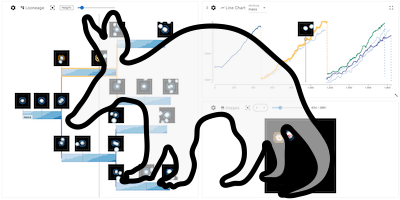
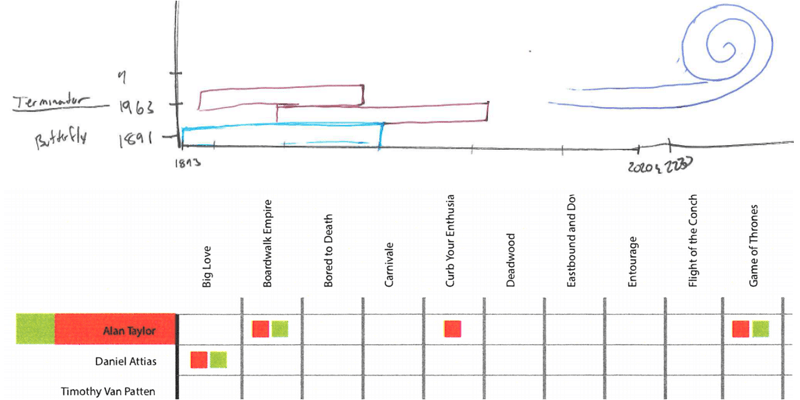
Aardvark: Composite Visualizations of Trees, Time-Series, and Images
IEEE Transactions on Visualization and Computer Graphics (VIS), 2024
IEEE VIS 2024 Best Paper Award
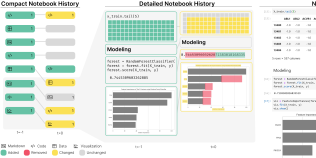
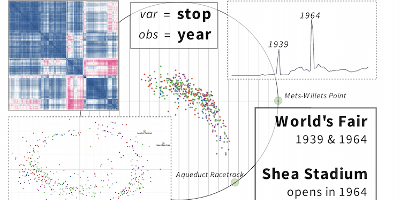
Loops: Leveraging Provenance and Visualization to Support Exploratory Data Analysis in Notebooks
IEEE Transactions on Visualization and Computer Graphics (VIS), 2024
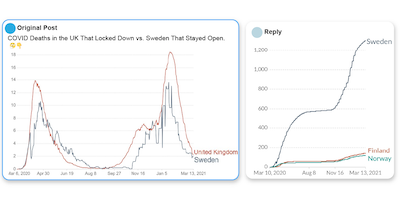
‘Yeah, this graph doesn't show that’: Analysis of Online Engagement with Misleading Data Visualizations
SIGCHI Conference on Human Factors in Computing Systems (CHI), 2024
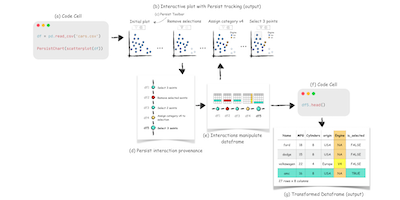
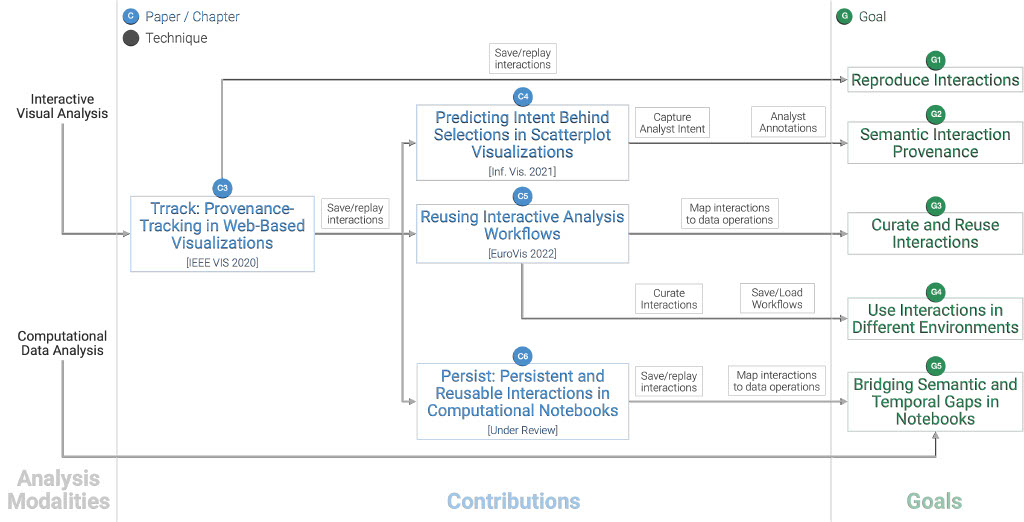
Persist: Persistent and Reusable Interactions in Computational Notebooks
Computer Graphics Forum (EuroVis), 2024
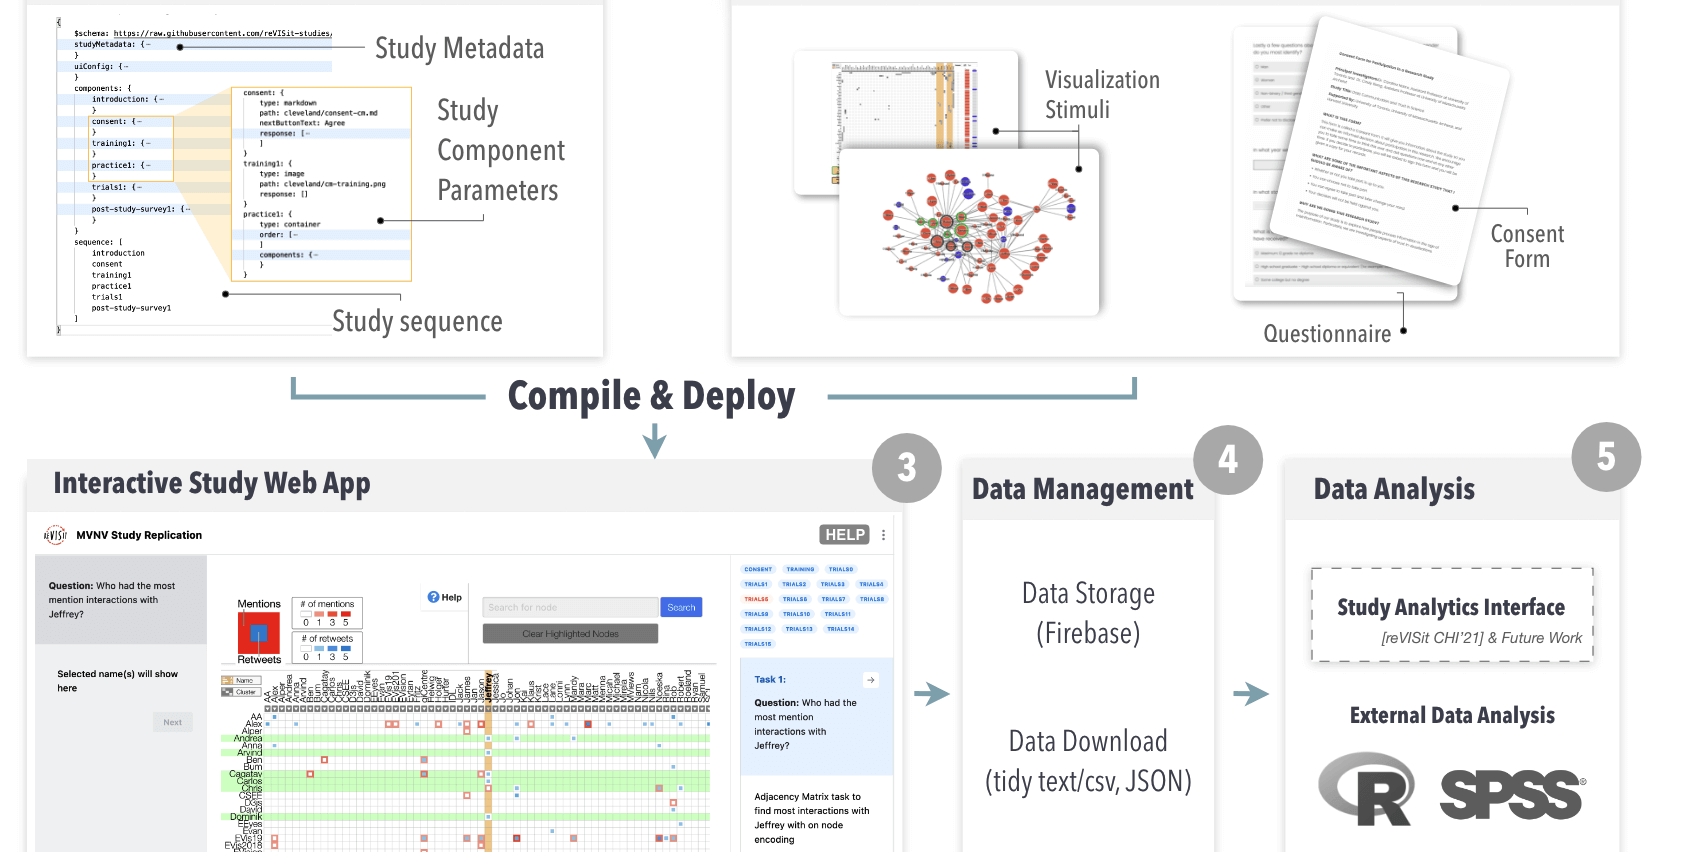
reVISit: Supporting Scalable Evaluation of Interactive Visualizations
IEEE Visualization and Visual Analytics (VIS), 2023
Ferret: Reviewing Tabular Datasets for Manipulation
Computer Graphics Forum (EuroVis), 2023
Troubling Collaboration: Matters of Care for Visualization Design Study
SIGCHI Conference on Human Factors in Computing Systems (CHI), 2023
Misleading Beyond Visual Tricks: How People Actually Lie with Charts
SIGCHI Conference on Human Factors in Computing Systems (CHI), 2023
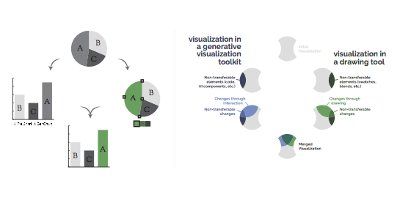
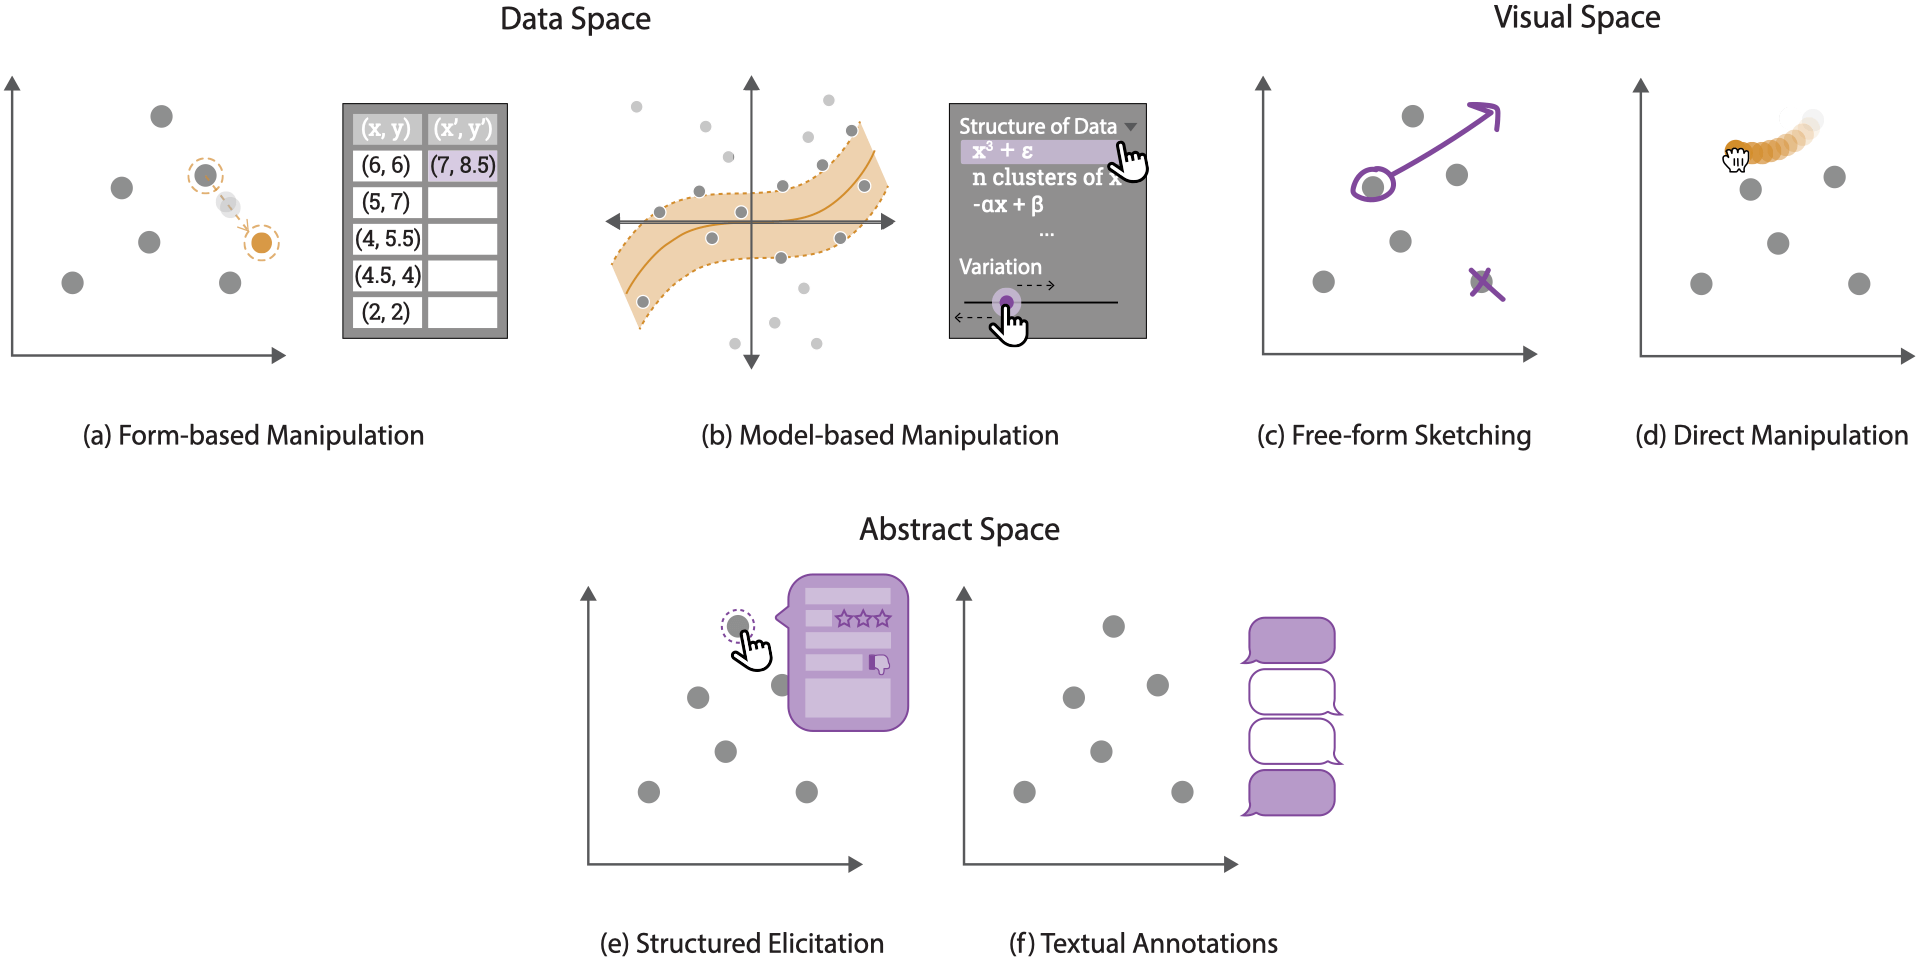
Data Hunches: Incorporating Personal Knowledge into Visualizations
IEEE Transactions on Visualization and Computer Graphics (VIS), 2022

Reusing Interactive Analysis Workflows
Computer Graphics Forum (EuroVis), 2022
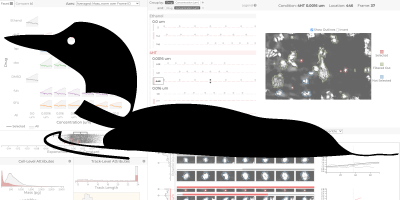
Loon: Using Exemplars to Visualize Large-Scale Microscopy Data
IEEE Transactions on Visualization and Computer Graphics (VIS), 2021
IEEE VIS 2021 Honorable Mention Award
An interview method for engaging personal data
The Proceedings of the ACM on Interactive, Mobile, Wearable and Ubiquitous Technologies (IMWUT), 2021
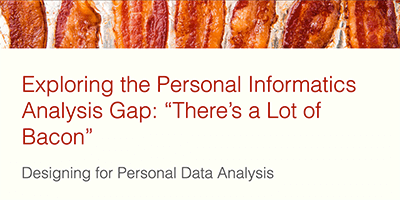
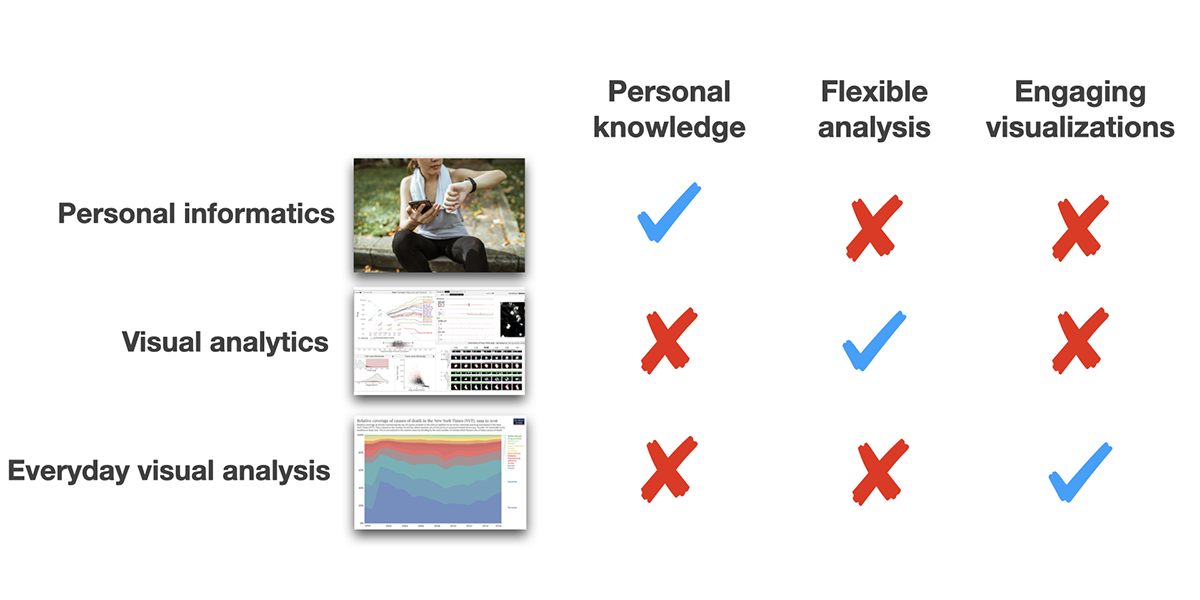
Exploring the Personal Informatics Analysis Gap: 'There's a Lot of Bacon'
IEEE Transactions on Visualization and Computer Graphics (VIS), 2021

Manifesto for Putting 'Chartjunk' in the Trash 2021!
alt.VIS, a workshop co-located with IEEE VIS, 2021
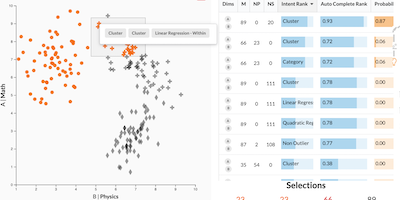
Predicting Intent Behind Selections in Scatterplot Visualizations
Information Visualization, 2021
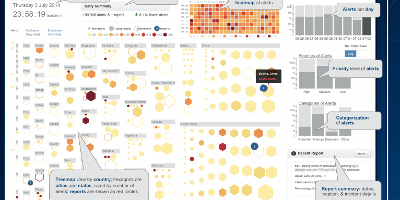
Sanguine: Visual Analysis for Patient Blood Management
Information Visualization, 2021
reVISit: Looking Under the Hood of Interactive Visualization Studies
SIGCHI Conference on Human Factors in Computing Systems (CHI), 2021
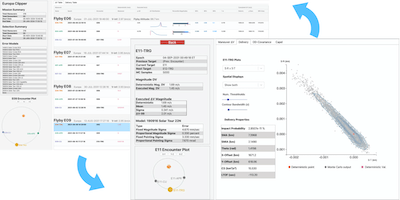
I'll Have the Porter: Interactively Visualizaing the Results of Statistical Maneuver Analysis
The Journal of the Astronautical Sciences, 2021
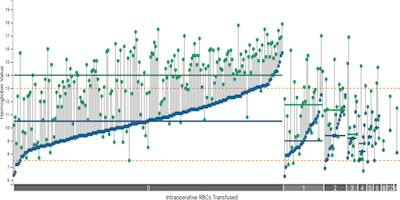
Sanguine: Visual Analysis for Patient Blood Management
Workshop on Visual Analytics in Healthcare at AMIA (VAHC), 2020
Insights From Experiments With Rigor in an EvoBio Design Study
IEEE Transactions on Visualization and Computer Graphics (InfoVis), 2021
Trrack: A Library for Provenance-Tracking in Web-Based Visualizations
IEEE Visualization Conference (VIS), 2020
HyperLabels: Browsing of Dense and Hierarchical Molecular 3D Models
IEEE Transactions on Visualization and Computer Graphics, 2020
Extending Recommendations for Creative Visualization-Opportunities Workshops
IEEE Evaluation and Beyond – Methodological Approaches for Visualization (BELIV), 2020
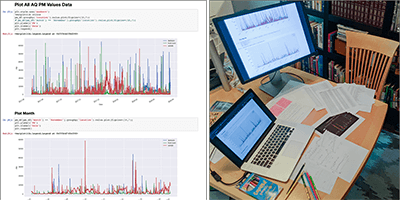
Indoor Household Particulate Matter Measurements Using a Network of Low-cost Sensors
Aerosol Air Quality Research, 2020
Evaluating Multivariate Network Visualization Techniques Using a Validated Design and Crowdsourcing Approach
SIGCHI Conference on Human Factors in Computing Systems (CHI), 2020
Taggle: Scalable Visualization of Tabular Data through Aggregation
Information Visualization, 2019
Criteria for Rigor in Visualization Design Study
IEEE Transactions on Visualization and Computer Graphics (InfoVis), 2019
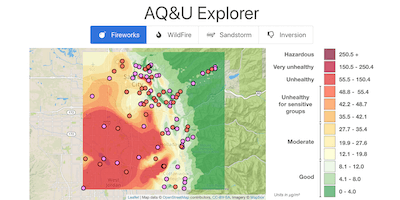
Engaging Middle and High School Students in Hypothesis Generation Using a Citizen-Scientist Network of Air Quality Sensors
American Insitute of Chemical Engineers, 2019
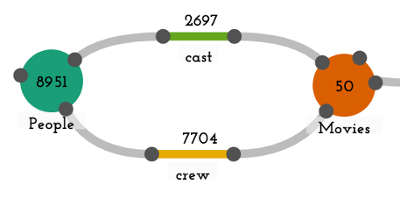
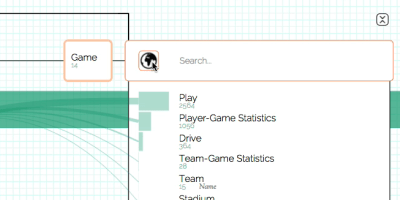
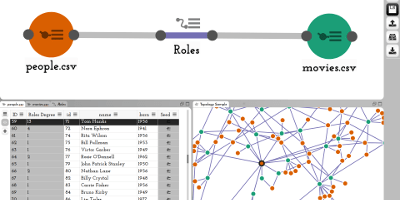
Origraph: Interactive Network Wrangling
IEEE Conference on Visual Analytics Science and Technology (VAST), 2019
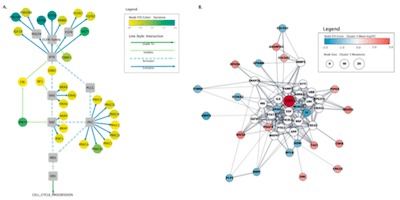
Ten Simple Rules to Create Biological Network Figures for Communication
PLOS Computational Biology, 2019
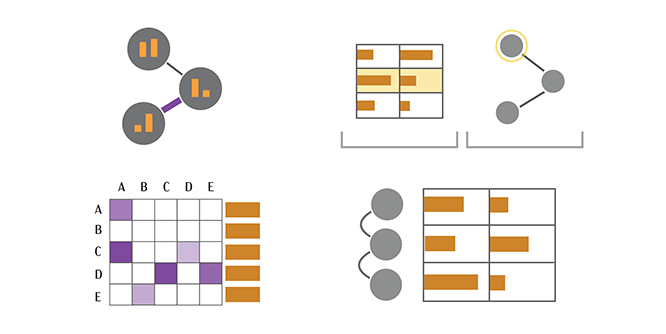
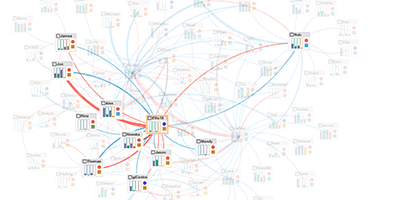
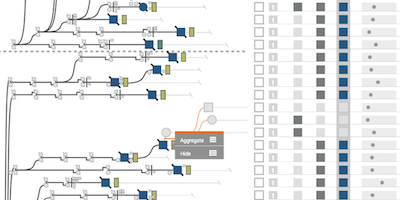
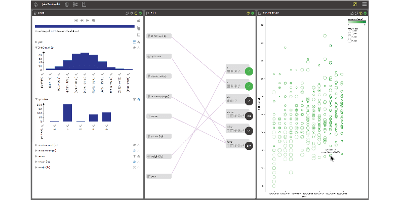
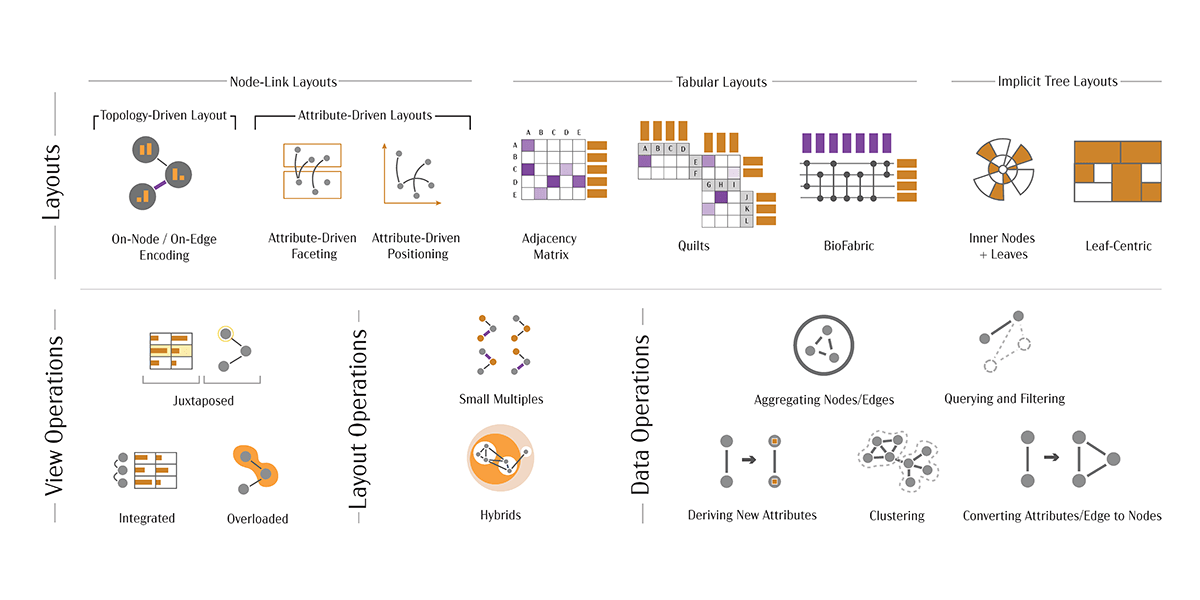
The State of the Art in Visualizing Multivariate Networks
Computer Graphics Forum (EuroVis), 2019
Examining Implicit Discretization in Spectral Schemes
Computer Graphics Forum (EuroVis), 2019
Jacob's Ladder: The User Implications of Leveraging Graph Pivots
IEEE Pacific Visualization Symposium (PacificVis), 2019
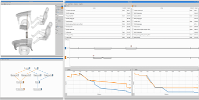
Composer: Visual Cohort Analysis of Patient Outcomes
Applied Clinical Informatics, 2019
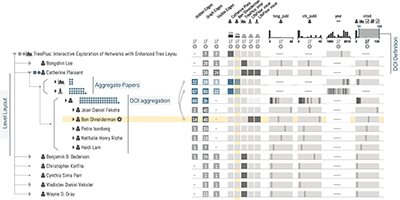
Juniper: A Tree+Table Approach to Multivariate Graph Visualization
IEEE Transactions on Visualization and Computer Graphics (InfoVis), 2019
A Framework for Creative Visualization-Opportunities Workshops
IEEE Transactions on Visualization and Computer Graphics (InfoVis), 2019
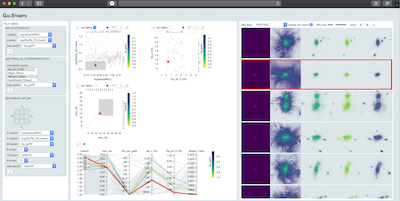
GalStamps: Analyzing Real and Simulated Galaxy Observations
IEEE Visualization Short Papers, 2019
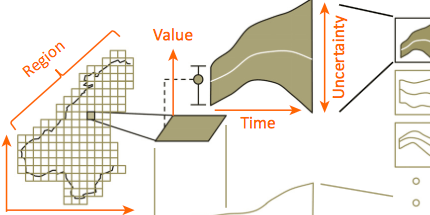
A Framework for Externalizing Implicit Error Using Visualization
IEEE Transactions on Visualization and Computer Graphics (InfoVis), 2019
Lineage: Visualizing Multivariate Clinical Data in Genealogy Graphs
IEEE Transactions on Visualization and Computer Graphics, 2019
Managing In-home Environments through Sensing, Annotating, and Visualizing Air Quality Data
Proceedings of the ACM on Interactive, Mobile, Wearable and Ubiquitous Technologies (IMWUT)(Ubicomp), 2018

EpiFi: An In-Home Sensor Network Architecture for Epidemiological Studies
2018 IEEE 43rd Conference on Local Computer Networks Workshops (LCN Workshops), 2018
Visualization of Big Spatial Data using Coresets for Kernel Density Estimates
IEEE Transactions on Big Data, early access, 2019
Composer: Visual Cohort Analysis of Patient Outcomes
Workshop on Visual Analytics in Healthcare at AMIA (VAHC 2018), 2018
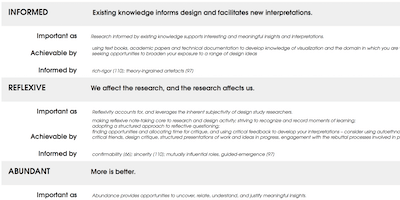
Reflection on Reflection in Applied Visualization Research
IEEE Computer Graphics and Applications, 2018
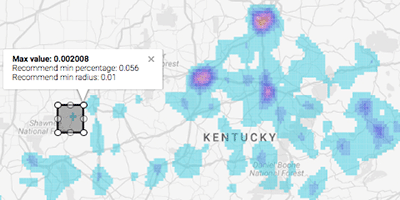
Visualization of Big Spatial Data using Coresets for Kernel Density Estimates
IEEE Symposium on Visualization in Data Science (VDS), 2017
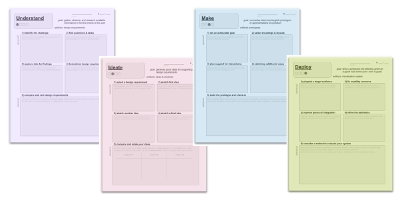
Worksheets for Guiding Novices through the Visualization Design Process
IEEE Workshop on Pedagogy of Data Visualization (PDV), 2017
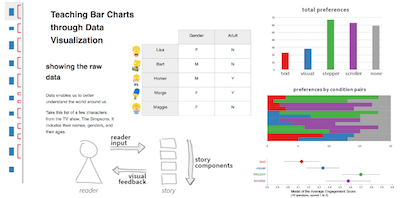
Visual Narrative Flow: Exploring Factors Shaping Data Visualization Story Reading Experiences
Computer Graphics Forum (EuroVis), 2017
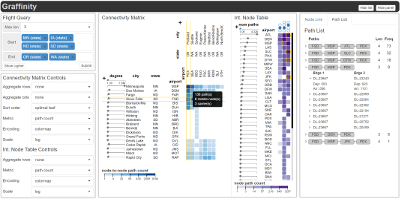
Graffinity: Visualizing Connectivity In Large Graphs
Computer Graphics Forum (EuroVis), 2017
How Sensemaking Tools Influence Display Space Usage
EuroVis Workshop on Visual Analytics (EuroVA), 2017
Interactive Visual Exploration And Refinement Of Cluster Assignments
BMC Bioinformatics, 2017
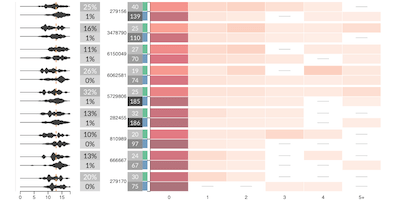
UpSetR: An R Package For The Visualization Of Intersecting Sets And Their Properties
Bioinformatics, 2017
Evaluating the Impact of Binning 2D Scalar Fields
IEEE Transactions on Visualization and Computer Graphics (InfoVis), 2017
Iterating Between Tools to Create and Edit Visualizations
IEEE Transactions on Visualization and Computer Graphics (InfoVis), 2016
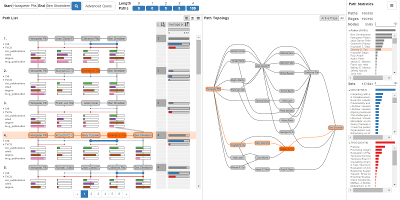
Pathfinder: Visual Analysis of Paths in Graphs
Computer Graphics Forum (EuroVis), 2016
EuroVis 2016 Honorable Mention Award
From Visual Exploration to Storytelling and Back Again
Computer Graphics Forum (EuroVis), 2016
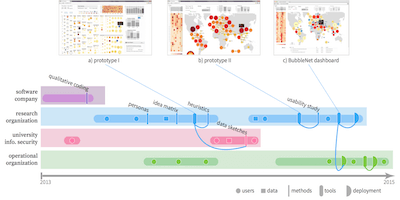
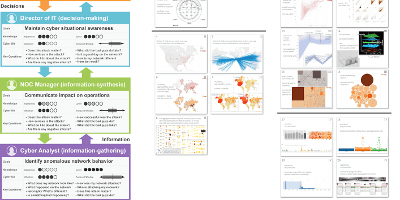
BubbleNet: A Cyber Security Dashboard for Visualizing Patterns
Computer Graphics Forum (EuroVis), 2016
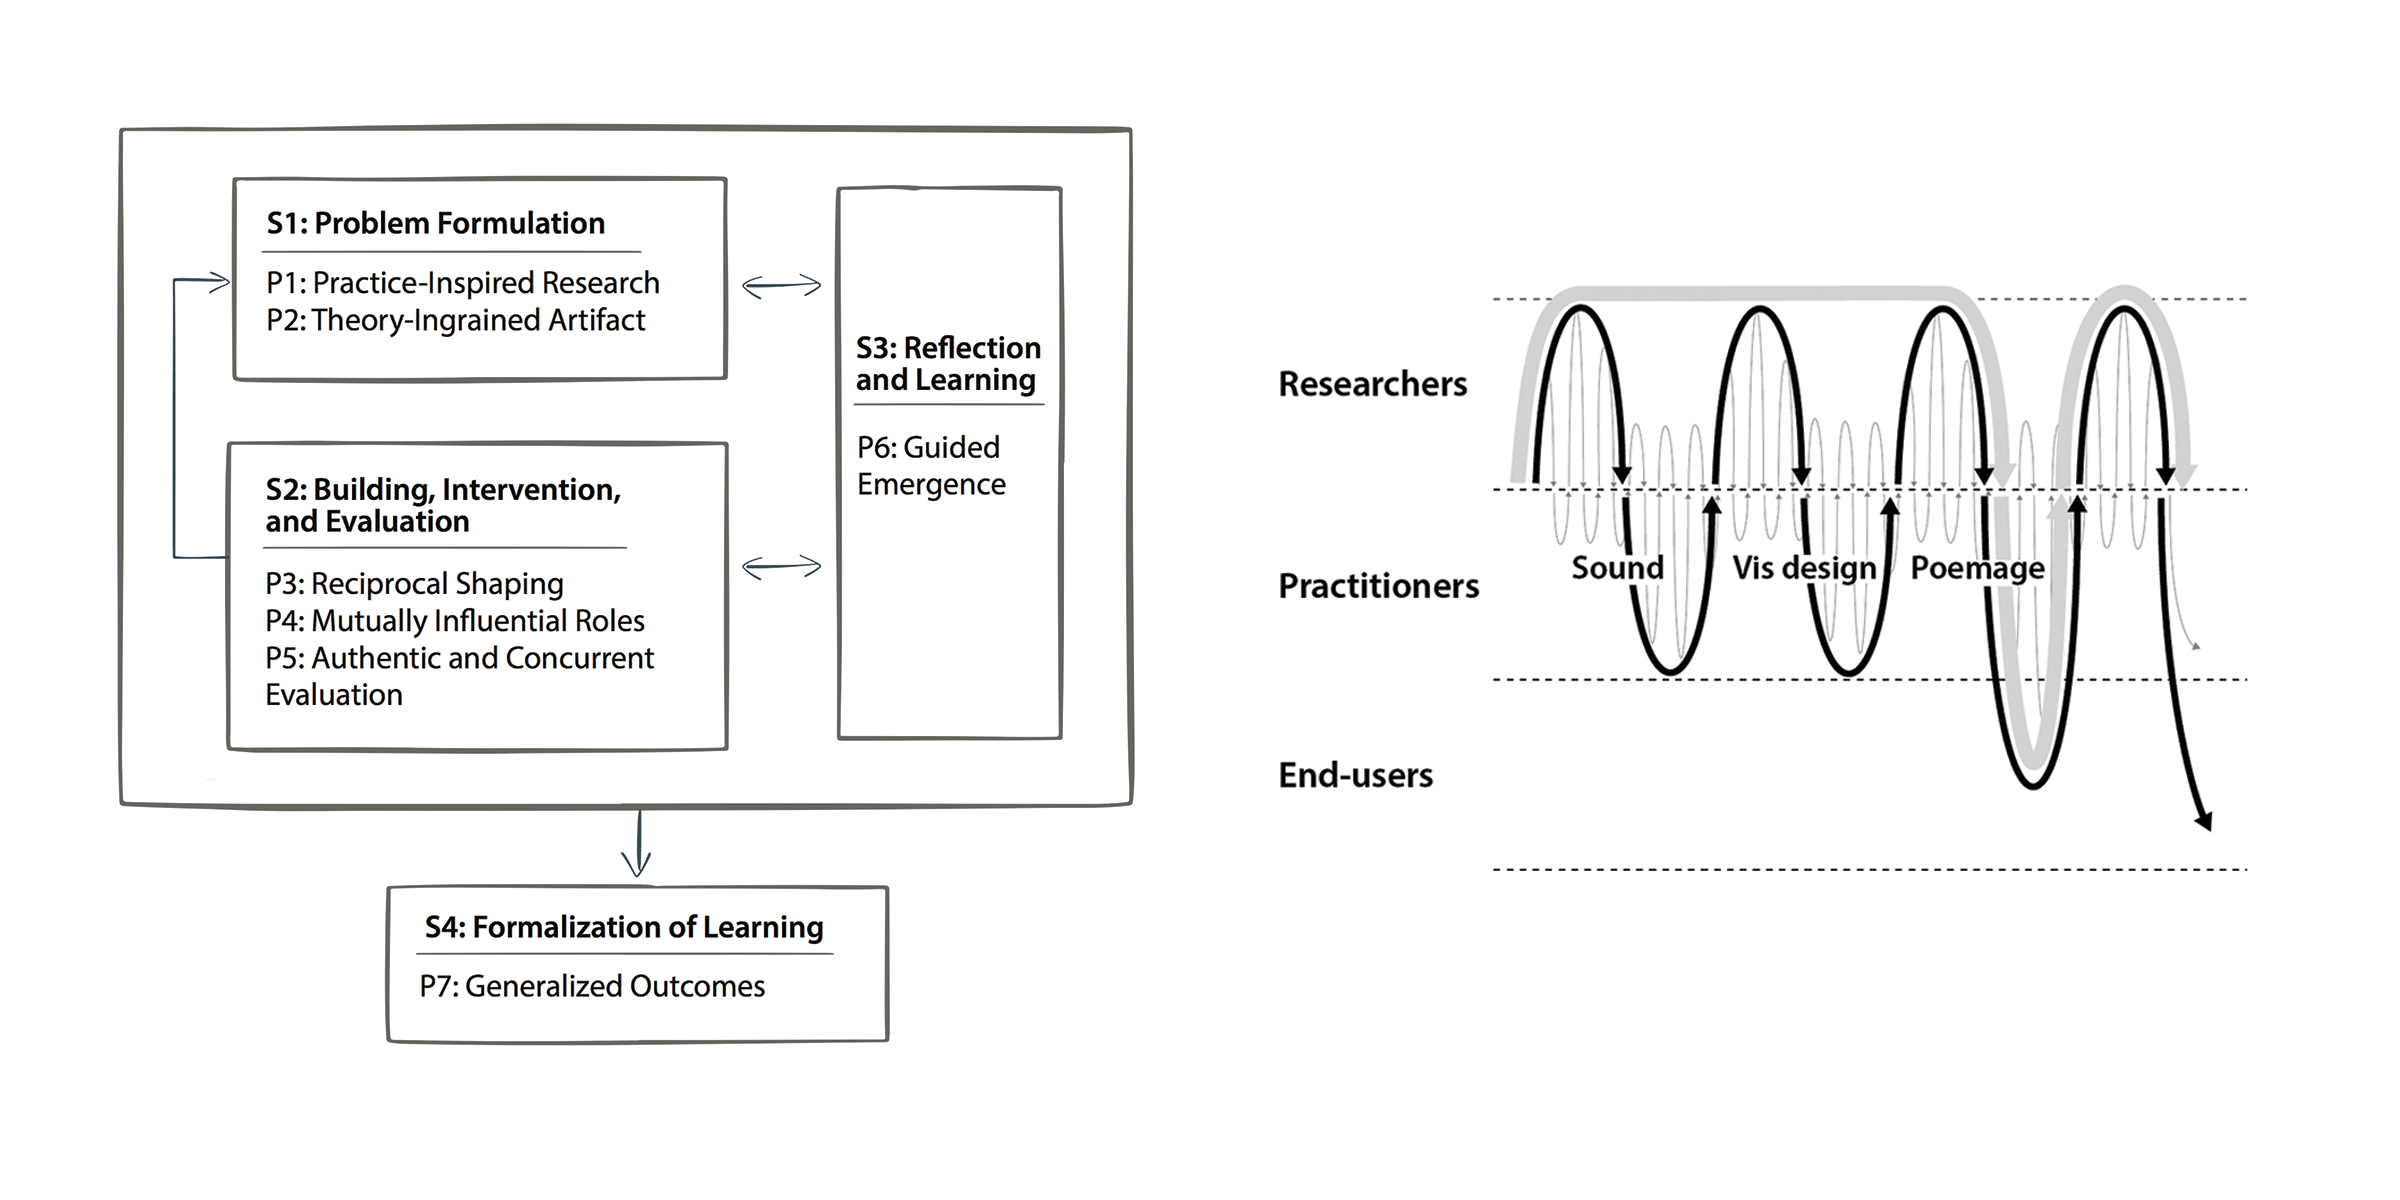
Action Design Research and Visualization Design
Proceedings of the Sixth Workshop on Beyond Time and Errors on Novel Evaluation Methods for Visualization, 2016
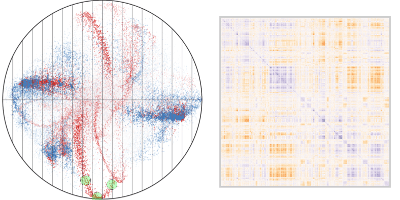
s-CorrPlot: An Interactive Scatterplot for Exploring Correlation
Journal of Computational and Graphical Statistics, 2016
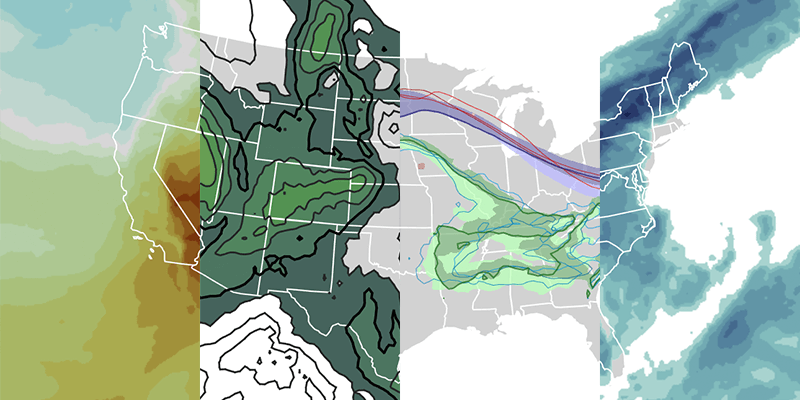
Visually Comparing Weather Features in Forecasts
IEEE Transactions on Visualization and Computer Graphics (InfoVis ’15), 2016
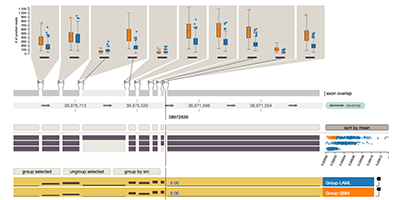
Vials: Visualizing Alternative Splicing of Genes
IEEE Transactions on Visualization and Computer Graphics (InfoVis ’15), 2016
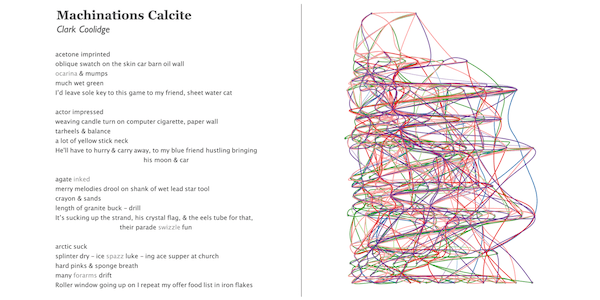
Poemage: Visualizing the Sonic Topology of a Poem
IEEE Transactions on Visualization and Computer Graphics (InfoVis ’15), 2016
Unlocking User-Centered Design Methods for Building Cyber Security Visualizations
Proceedings of the 12th International Symposium on Visualization for Cyber Security (VIS ’15), 2015
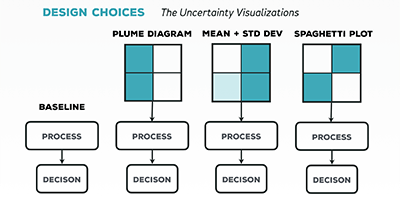
Towards Ecological Validity in Evaluating Uncertainty
Proceedings of Workshop on Visualization for Decision Making Under Uncertainty (VIS), 2015
A Shot at Visual Vulnerability Analysis
Computer Graphics Forum (EuroVis), 2015
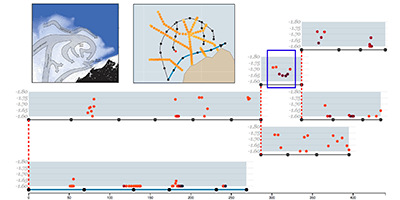
OceanPaths: Visualizing Multivariate Oceanography Data
Proceedings of the Eurographics Conference on Visualization (EuroVis ’15) - Short Papers, 2015
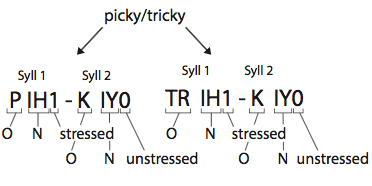
RhymeDesign: A Tool for Analyzing Sonic Devices in Poetry
Proceedings of the Workshop on Computational Linguistics for Literature, NAACL HLT, 2015
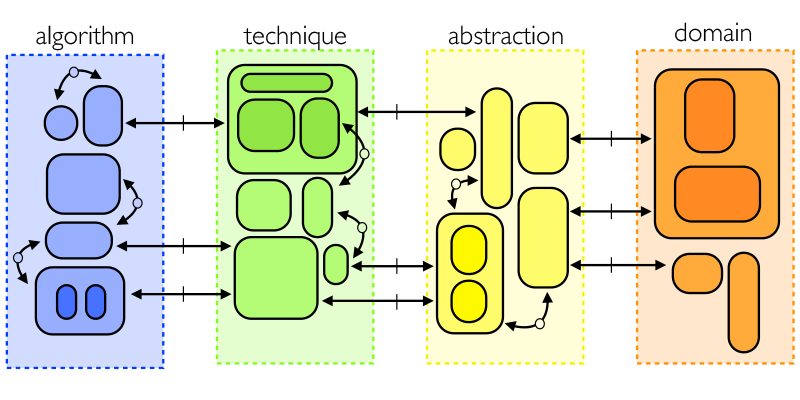
The Nested Blocks and Guidelines Model
Information Visualization, 2015
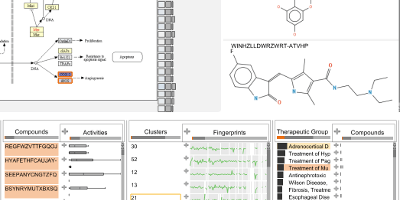
ConTour: Data-Driven Exploration of Multi-Relational Datasets for Drug Discovery
IEEE Transactions on Visualization and Computer Graphics (VAST), 2014
Information visualisation for science and policy: engaging users and avoiding bias
Trends in Ecology & Evolution, 2014
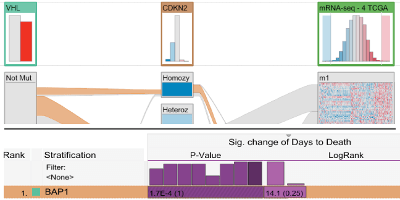
Guided Visual Exploration of Genomic Stratifications in Cancer
Nature Methods, 2014
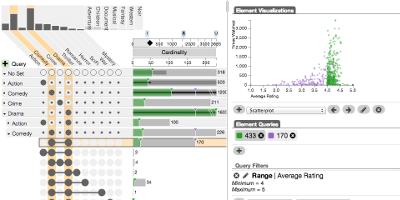
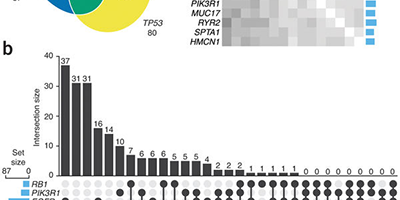
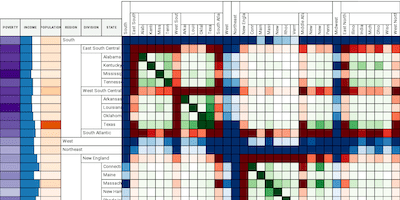
UpSet: Visualization of Intersecting Sets
IEEE Transactions on Visualization and Computer Graphics (InfoVis), 2014
10 Year InfoVis Test of Time Award, 2024
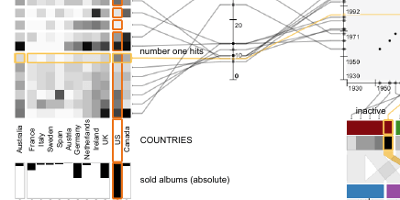
Domino: Extracting, Comparing, and Manipulating Subsets across Multiple Tabular Datasets
IEEE Transactions on Visualization and Computer Graphics (InfoVis), 2014
IEEE InfoVis 2014 Honorable Mention Award
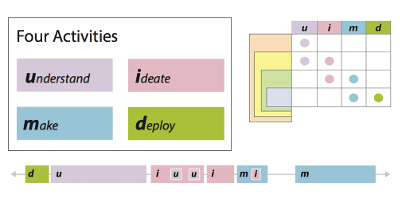
Design Activity Framework for Visualization Design
IEEE Transactions on Visualization and Computer Graphics (InfoVis ’14), 2014
Show me the Invisible: Visualizing Hidden Content
Proceedings of the SIGCHI Conference on Human Factors in Computing Systems (CHI ’14), 2014
ACM CHI 2014 Honorable Mention Award
Characterizing Cancer Subtypes using the Dual Analysis Approach in Caleydo StratomeX
IEEE Computer Graphics and Applications, 2014
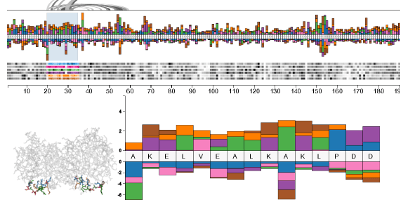
Mu-8: Visualizing Differences between Proteins and their Families
BMC Proceedings, 2014
Reflections on How Designers Design With Data
AVI 2014 International Working Conference on Advanced Visual Interfaces (AVI ’14), 2014
AVI 2014 Best Paper Award
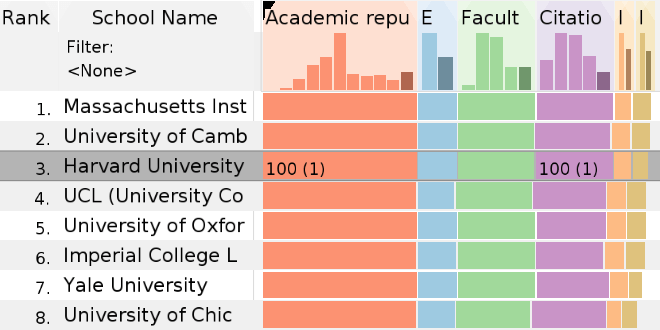
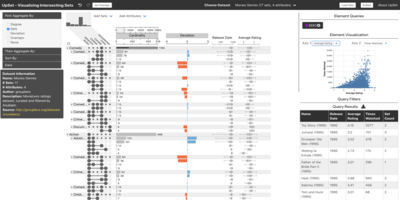
LineUp: Visual Analysis of Multi-Attribute Rankings
IEEE Transactions on Visualization and Computer Graphics (InfoVis), 2013
IEEE InfoVis 2013 Best Paper Award
Entourage: Visualizing Relationships between Biological Pathways using Contextual Subsets
IEEE Transactions on Visualization and Computer Graphics (InfoVis), 2013
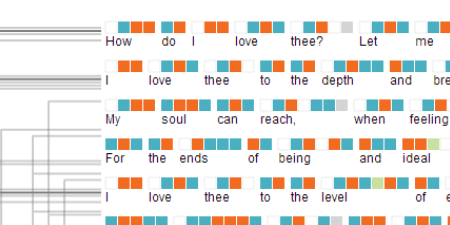
Rule-based Visual Mappings with a Case Study on Poetry Visualization
Computer Graphics Forum (EuroVis), 2013
Visualization Collaborations: Reflections on What Works and Why
IEEE Computer Graphics and Applications, 2013
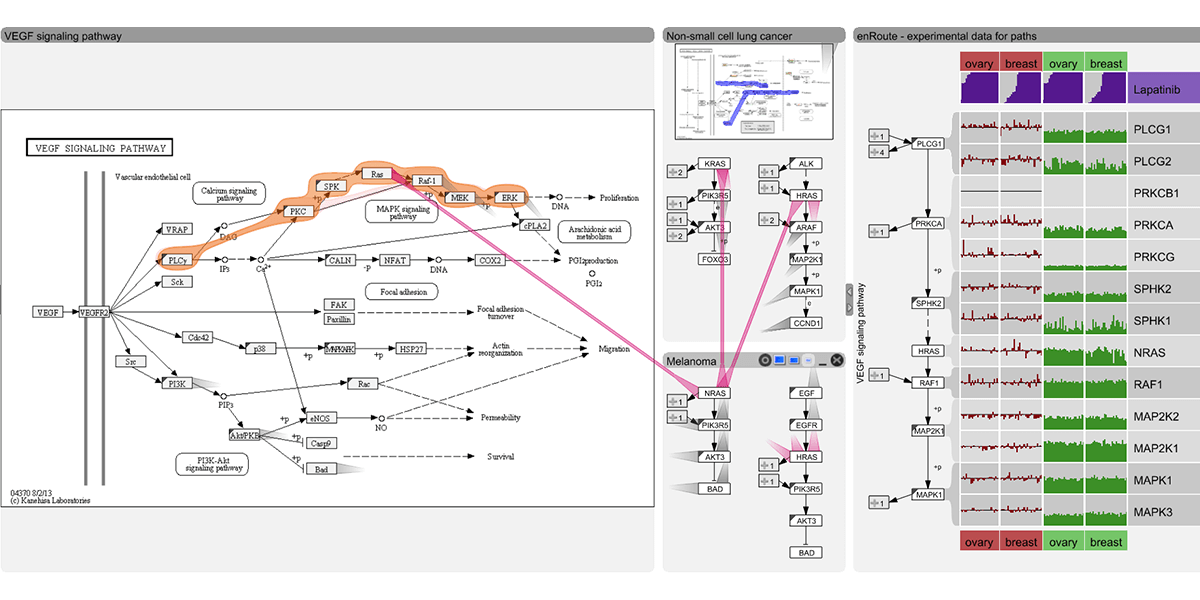
enRoute: Dynamic Path Extraction from Biological Pathway Maps for Exploring Heterogeneous Experimental Datasets
BMC Bioinformatics, 2013
Visualizing Uncertainty in Biological Expression Data
Proceedings of the SPIE Conference on Visualization and Data Analysis (VDA), 2012
Model-Driven Design for the Visual Analysis of Heterogeneous Data
IEEE Transactions on Visualization and Computer Graphics, 2012
Design Study Methodology: Reflections from the Trenches and the Stacks
IEEE Transactions on Visualization and Computer Graphics (InfoVis), 2012
IEEE InfoVis 2012 Honorable Mention Award
StratomeX: Visual Analysis of Large-Scale Heterogeneous Genomics Data for Cancer Subtype Characterization
Computer Graphics Forum (EuroVis), 2012
EuroVis 2012 3rd Best Paper Award
Aggregate Gaze Visualization with Real-time Heatmaps
Proceedings of the ACM Symposium on Eye Tracking Research & Applications (ETRA), 2012
enRoute: Dynamic Path Extraction from Biological Pathway Maps for In-Depth Experimental Data Analysis
Proceedings of the IEEE Symposium on Biological Data Visualization (BioVis ’12), 2012
IEEE BioVis 2012 Best Paper Award
The Four-Level Nested Model Revisited Blocks and Guidelines
Proceedings of the Workshop on BEyond time and errors: novel evaLuation methods for Information Visualization (BELIV), 2012
A Conserved Developmental Patterning Network Produces Quantitatively Different Output in Multiple Species of Drosophila
PLoS Genetics, 2011
Visualizing the Effects of Logically Combined Filters
Proceedings of the Conference on Information Visualisation (IV ’2011), 2011
VisBricks: Multiform Visualization of Large, Inhomogeneous Data
IEEE Transactions on Visualization and Computer Graphics (InfoVis), 2011
Context-Preserving Visual Links
IEEE Transactions on Visualization and Computer Graphics (InfoVis'11), 2011
IEEE InfoVis 2011 Best Paper Award
Caleydo: Design and Evaluation of a Visual Analysis Framework for Gene Expression Data in its Biological Context
Proceedings of IEEE Pacific Visualization Symposium (PacificVis), 2010
MulteeSum: A Tool for Comparative Spatial and Temporal Gene Expression Data
IEEE Transactions on Visualization and Computer Graphics (InfoVis), 2010
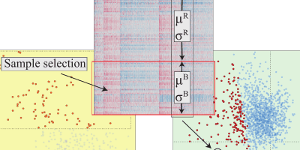
Comparative Analysis of Multidimensional, Quantitative Data
IEEE Transactions on Visualization and Computer Graphics (InfoVis), 2010
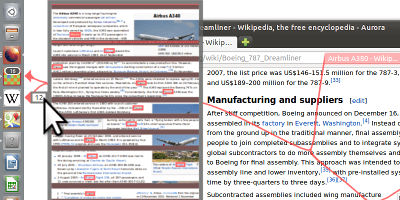
Visual Links across Applications
Proceedings of the Graphics Interface (GI), 2010
GI 2010 Best Student Paper Award
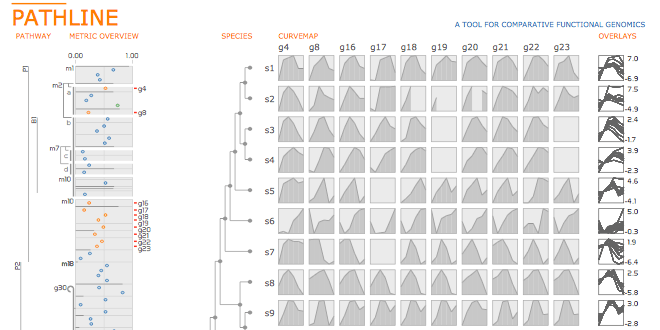
Pathline: A Tool for Comparative Functional Genomics
Computer Graphics Forum (EuroVis), 2010
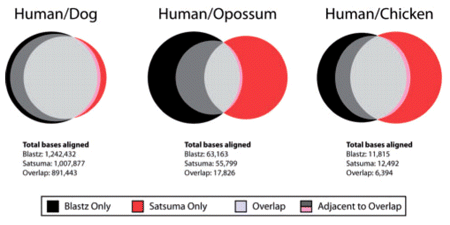
Genome-wide synteny through highly sensitive sequence alignment: Satsuma.
Bioinformatics, 2010
Connecting Genes with Diseases
Proceedings of the Conference on Information Visualisation (IV ’09), 2009
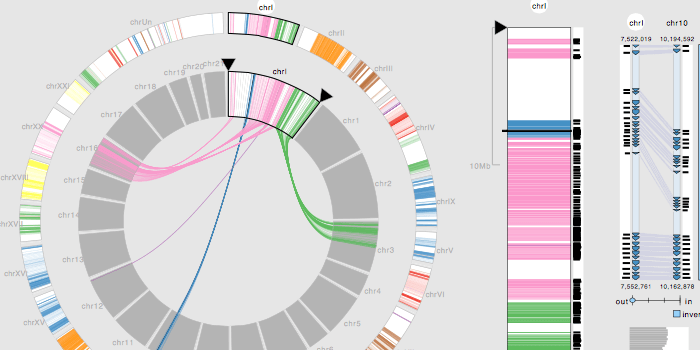
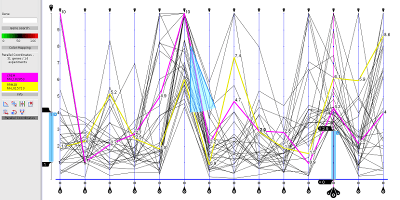
MizBee: A Multiscale Synteny Browser,
IEEE Transactions on Visualization and Computer Graphics (InfoVis), 2009
IEEE InfoVis 2009 Honorable Mention Award
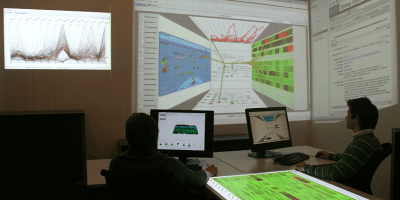
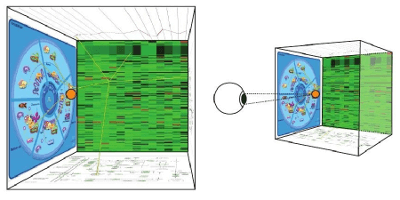
Design Considerations for Collaborative Information Workspaces in Multi-Display Environments
Proceedings of Workshop on Collaborative Visualization on Interactive Surfaces (CoVIS'09, VisWeek), 2009
Gaze-Based Focus Adaption in an Information Visualization System
Proceedings of the Conference on Computer Graphics and Visualization and Image Processing (CGVCVIP), 2009
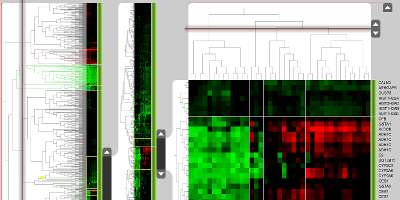
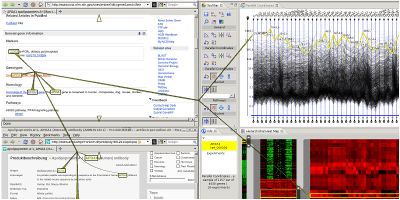
Caleydo: Connecting Pathways with Gene Expression
Bioinformatics, 2009
Commentary
Points of view: Sets and intersections
Nature Methods, 2014
Selected Posters
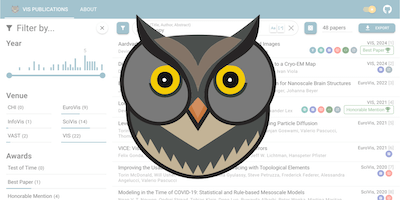
Vispubs.com: A Visualization Publications Repository
Preprint, 2024
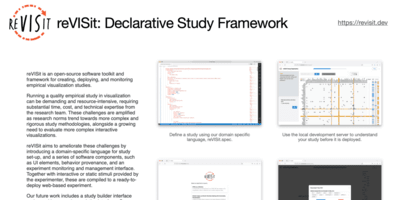
ReVISit: Declarative Study Framework
NSF CIRC PI Meeting, 2023
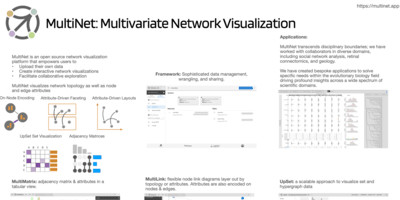
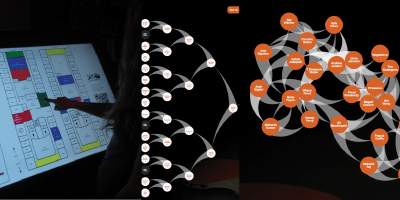
MultiNet: Multivariate Network Visualization
NSF CSSI PI Meeting, 2023
UpSet 2: From Prototype to Tool
Proceedings of the IEEE Information Visualization Conference – Posters (InfoVis ’19), 2019
TaMax: Visualizing Dense Multivariate Networks with Adjacency Matrices
Proceedings of the IEEE Information Visualization Conference – Posters (InfoVis ’19), 2019
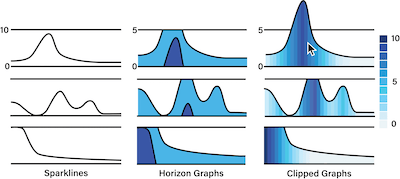
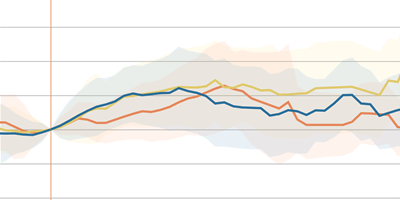
Clipped Graphs: A Compact Time-Series Encoding
Proceedings of the IEEE Information Visualization Conference – Posters (InfoVis), 2019
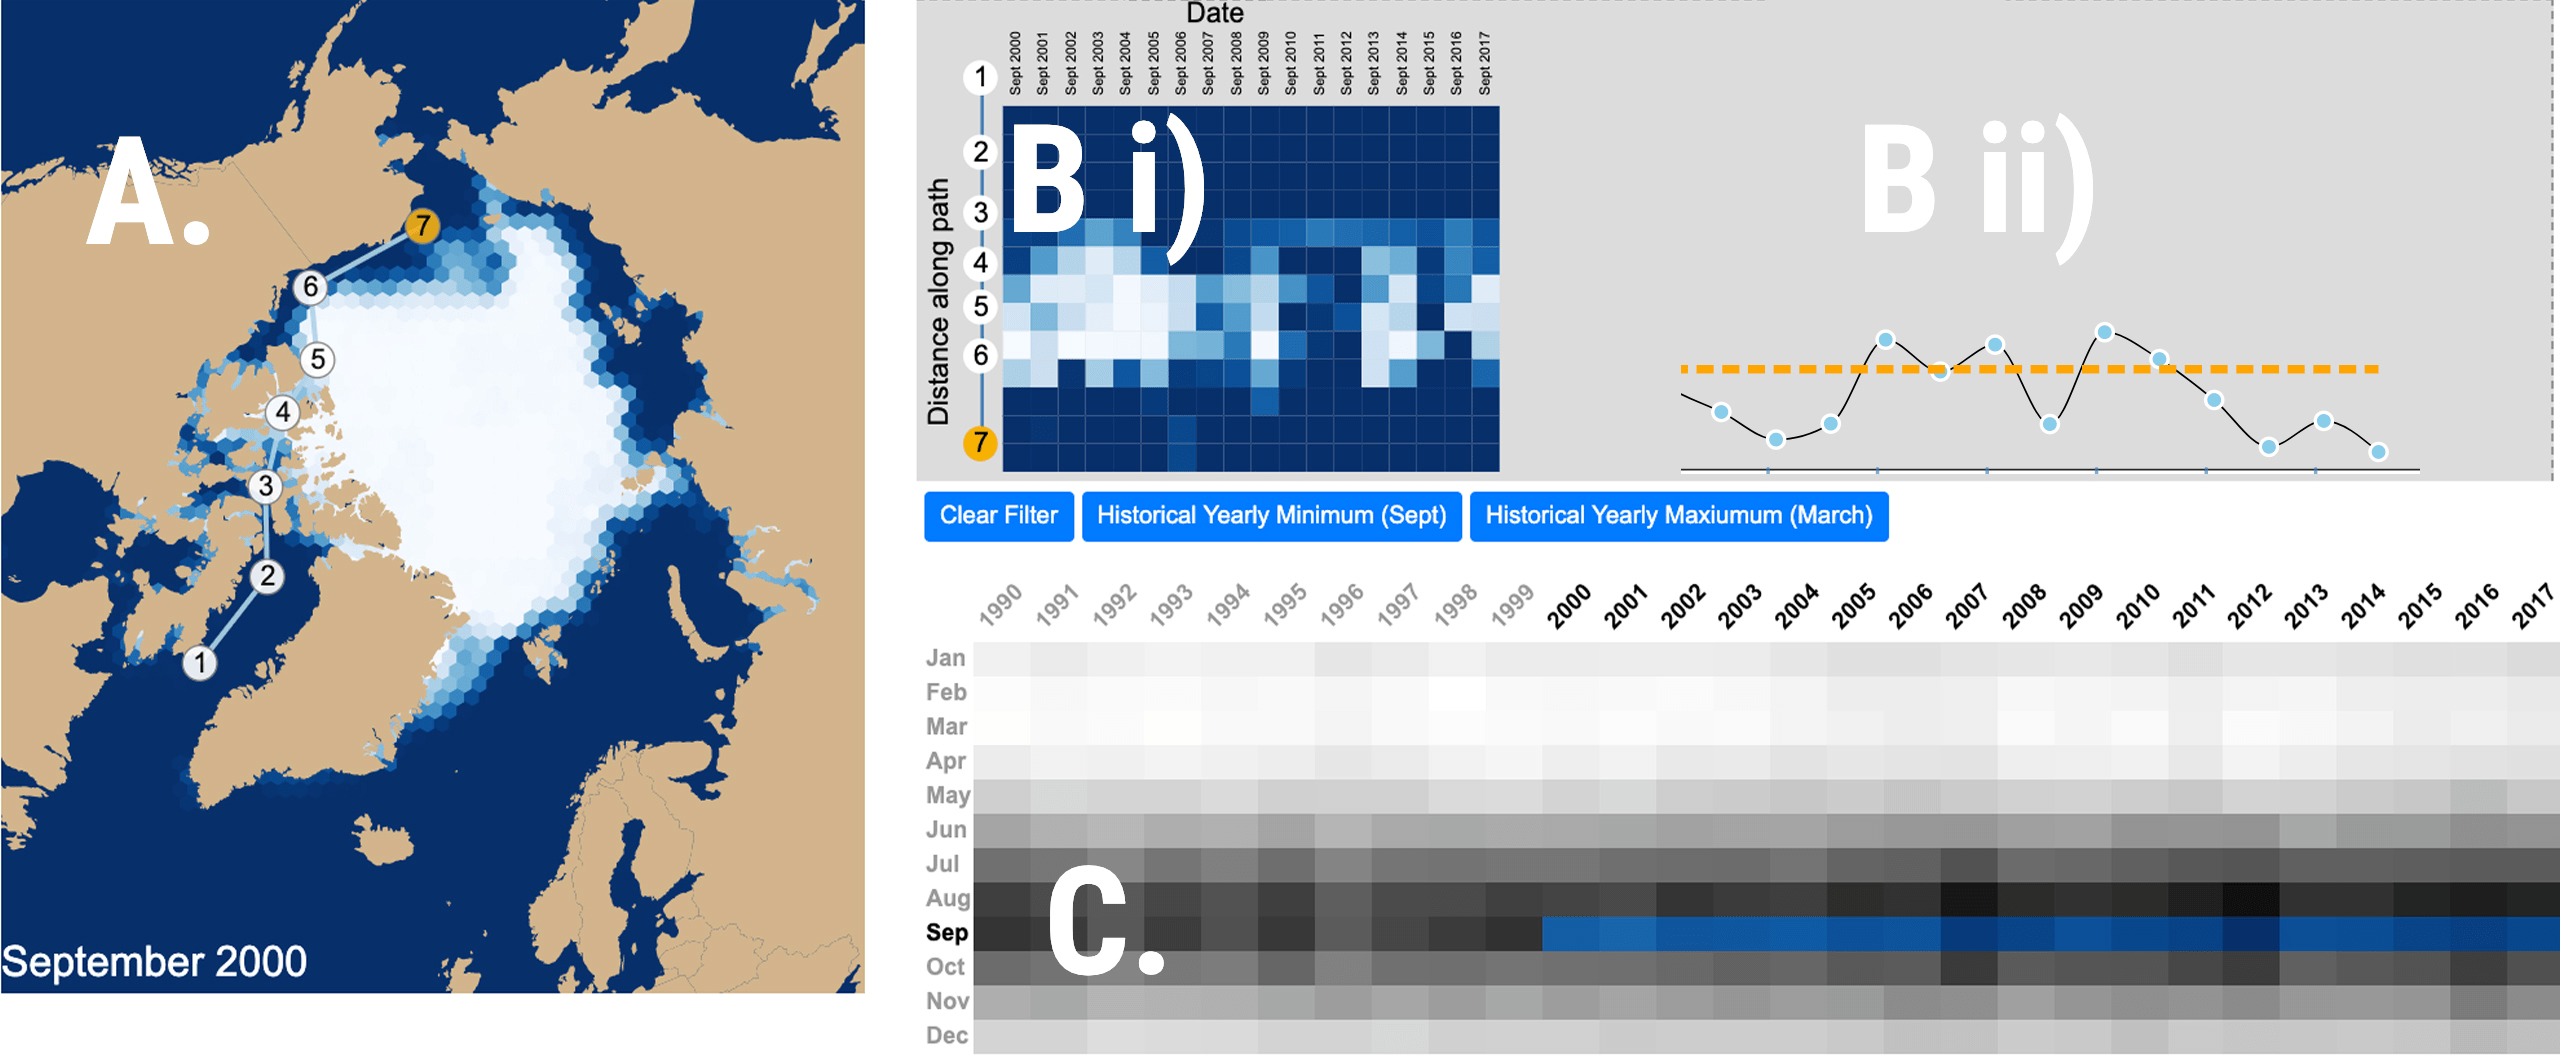
Arctic Explorer: Visualization of Sea-Ice Concentration along Arctic Shipping Routes
Proceedings of the IEEE Information Visualization Conference – Posters (InfoVis), 2019
Mure.js: Toward Flexible Authoring and Reshaping of Networks
Proceedings of the IEEE Information Visualization Conference - Posters (InfoVis), 2018
Composer: Visual Cohort Analysis of Patient Outcomes
Proceedings of the IEEE Information Visualization Conference - Posters, 2018

Lineage
Proceedings of the IEEE Information Visualization Conference - Posters (InfoVis), 2017
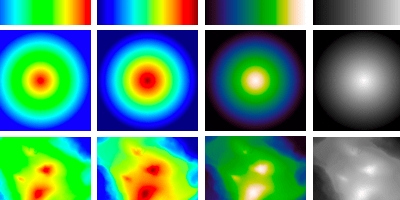
Hue Bands and Human Perception: Revisiting the Rainbow
Proceedings of the IEEE Information Visualization Conference - Posters (InfoVis), 2017
Reflections on Working With Fellow Tool Builders
Proceedings of the IEEE Information Visualization Conference - Posters (InfoVis), 2017
Resonant Laboratory and Candela: Spreading Your Visualization Ideas to the Masses
Proceedings of Workshop on Visualization in Practice (VIP), 2016
VIP 2016 Best Paper Award
Designing STAR: A Cyber Dashboard Prototype
Proceedings of the 11th International Symposium on Visualization for Cyber Security - Posters (VIS ’14), 2014
s-CorrPlot: Encoding and Exploring Correlation
Proceedings of the IEEE Information Visualization Conference - Posters (InfoVis ’14), 2014
compariSeq: Rethinking Sequence Logos
Proceedings of the IEEE Symposium on Biological Data Visualization - Redesign Contest Poster (BioVis ’13), 2013

compreheNGSive: A Tool for Exploring Next-Gen Sequencing Variants
Proceedings of the IEEE Symposium on Biological Data Visualization - Posters (BioVis ’12), 2012
Dissertations and Theses

Designing Resilient Visualizations Toward More Accurate Data Discourse
University of Utah, PhD Thesis, May 2025
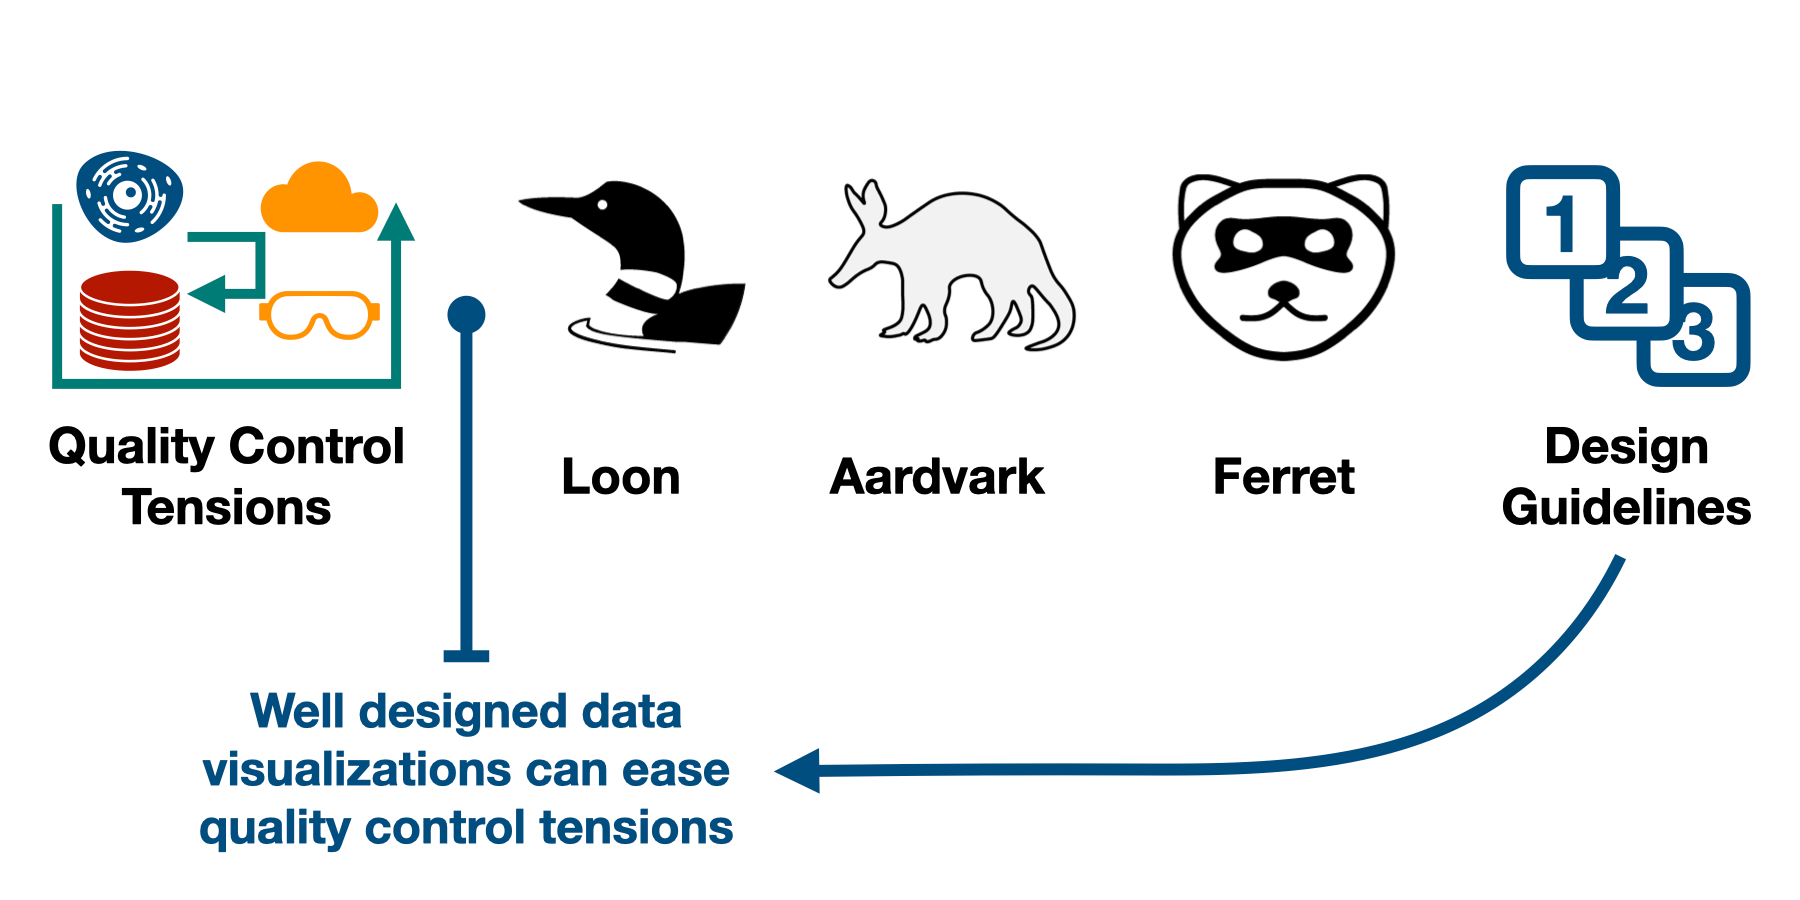
Is that Right? Data Visualizations for Scientific Quality Control
University of Utah, PhD Thesis, July 2024
Toward Reproducible and Reusable Visual Analysis
University of Utah, PhD Thesis, March 2024
Traceability in Design-Oriented Visualization Research
University of Utah, PhD Thesis, May 2023
Data Hunches: Expressing Personal Knowledge in Data Visualizations
University of Utah, PhD Thesis, December 2023
The Personal Informatics Analysis Gap
University of Utah, PhD Thesis, May 2022
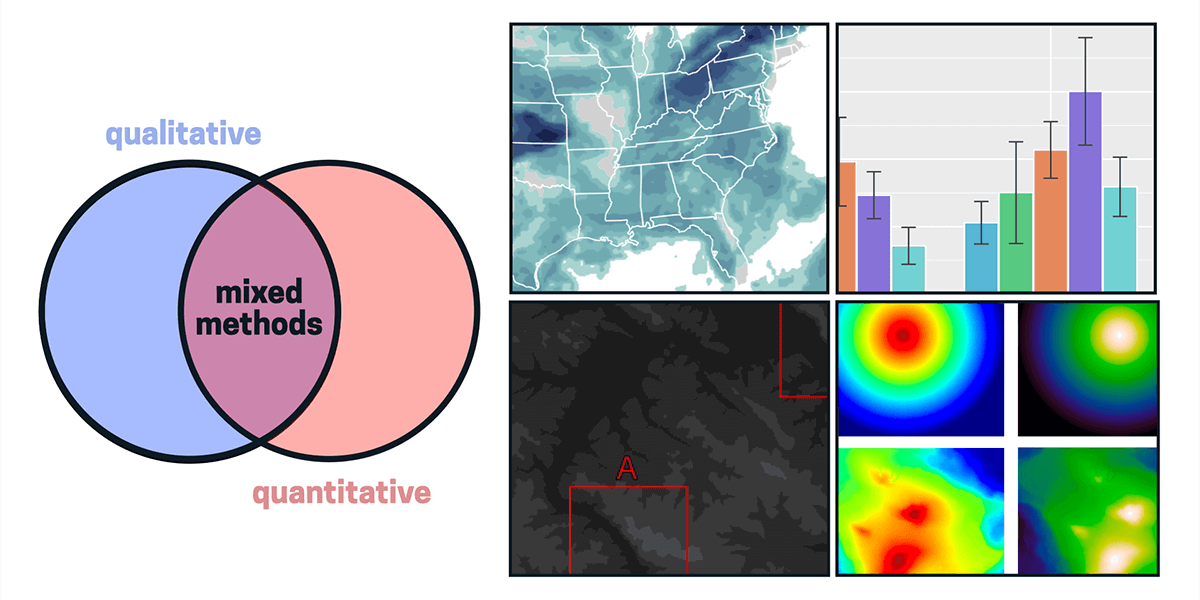
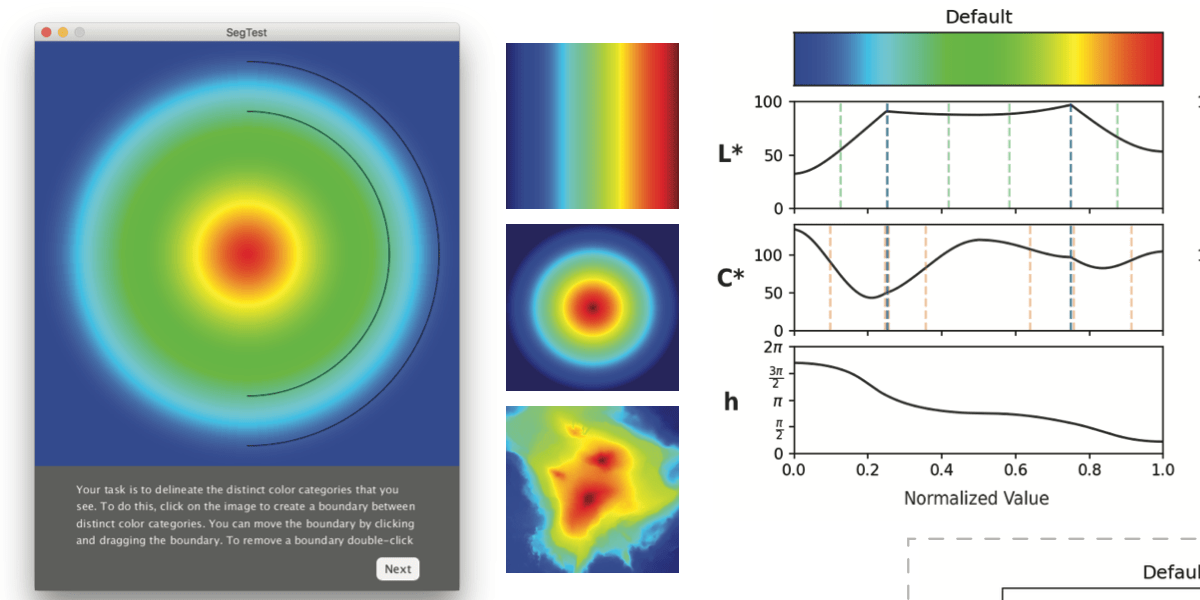
A Mixed-Methods Exploration of Color Encodings for Two-Dimensional Scalar Fields
University of Utah, PhD Thesis, May 2020
Visualizing Multivariate Networks
University of Utah, PhD Thesis, May 2020
Action Design Research for Applied Visualization Design
University of Utah, PhD Thesis, May 2020
A Framework for Creative Visualization-Opportunities Workshops
University of Utah, PhD Thesis, May 2019
Best Dissertation Award by the School of Computing, University of Utah
Reflections, Models, and Software for Iterative Visualization Design
University of Utah, PhD Thesis, May 2019
The Design Activity Framework: Investigating the Data Visualization Design Process
University of Utah, PhD Dissertation, June 2017
Visualization of Multidimensional Data with Applications in Molecular Biology
Graz University of Technology, PhD Thesis, March 2012
Best Dissertation Award, awarded by "Forum Technology and Society", Graz University of Technology
Driving Genetics With Experimental Visualization
University of Utah, Bachelor Thesis, May 2012